The new Prometheus version 2.13.0 is available and as always, it includes many fixes and improvements. You can read what's changed here. However, there is one feature that some projects and users were waiting for: chunked, streamed version of remote read API.
In this article I would like to present a deep dive of what we changed in the remote protocol, why it was changed and how to use it effectively.
Remote APIs
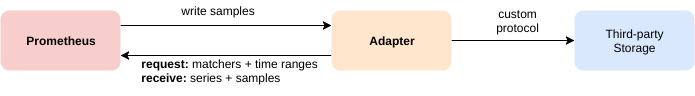
Since version 1.x, Prometheus has the ability to interact directly with its storage using the remote API.
This API allows 3rd party systems to interact with metrics data through two methods:
- Write - receive samples pushed by Prometheus
- Read - pull samples from Prometheus
Both methods are using HTTP with messages encoded with protobufs. The request and response for both methods are compressed using snappy.
Remote Write
This is the most popular way to replicate Prometheus data into 3rd party system. In this mode, Prometheus streams samples, by periodically sending a batch of samples to the given endpoint.
Remote write was recently improved massively in March with WAL-based remote write which improved the reliability and resource consumption. It is also worth to note that the remote write is supported by almost all 3rd party integrations mentioned here.
Remote Read
The read method is less common. It was added in March 2017 (server side) and has not seen significant development since then.
The release of Prometheus 2.13.0 includes a fix for known resource bottlenecks in the Read API. This article will focus on these improvements.
The key idea of the remote read is to allow querying Prometheus storage (TSDB) directly without PromQL evaluation.
It is similar to the Querier interface
that the PromQL engine uses to retrieve data from storage.
This essentially allows read access of time series in TSDB that Prometheus collected. The main use cases for remote read are:
- Seamless Prometheus upgrades between different data formats of Prometheus, so having Prometheus reading from another Prometheus.
- Prometheus being able to read from 3rd party long term storage systems e.g InfluxDB.
- 3rd party system querying data from Prometheus e.g Thanos.
The remote read API exposes a simple HTTP endpoint that expects following protobuf payload:
message ReadRequest {
  repeated Query queries = 1;
}

message Query {
  int64 start_timestamp_ms = 1;
  int64 end_timestamp_ms = 2;
  repeated prometheus.LabelMatcher matchers = 3;
  prometheus.ReadHints hints = 4;
}
With this payload, the client can request certain series matching given matchers and time range with end and start.
The response is equally simple:
message ReadResponse {
  // In same order as the request's queries.
  repeated QueryResult results = 1;
}

message Sample {
  double value    = 1;
  int64 timestamp = 2;
}

message TimeSeries {
  repeated Label labels   = 1;
  repeated Sample samples = 2;
}

message QueryResult {
  repeated prometheus.TimeSeries timeseries = 1;
}
Remote read returns the matched time series with raw samples of value and timestamp.
Problem Statement
There were two key problems for such a simple remote read. It was easy to use and understand, but there were no
streaming capabilities within single HTTP request for the protobuf format we defined. Secondly, the response was
including raw samples (float64 value and int64 timestamp) instead of
an encoded, compressed batch of samples called "chunks" that are used to store metrics inside TSDB.
The server algorithm for remote read without streaming was:
- Parse request.
- Select metrics from TSDB.
- For all decoded series:
- For all samples:
- Add to response protobuf
- For all samples:
- Marshal response.
- Snappy compress.
- Send back the HTTP response.
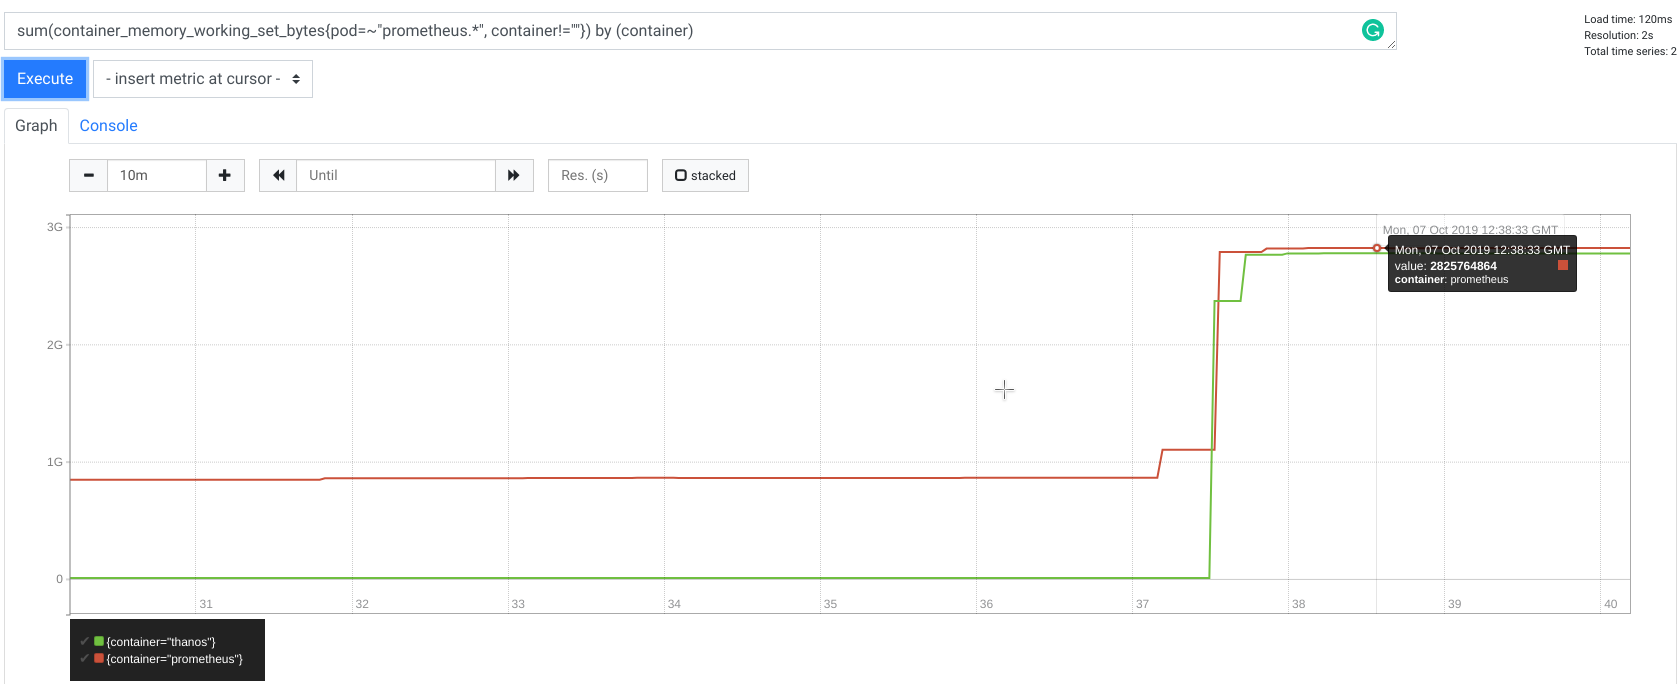
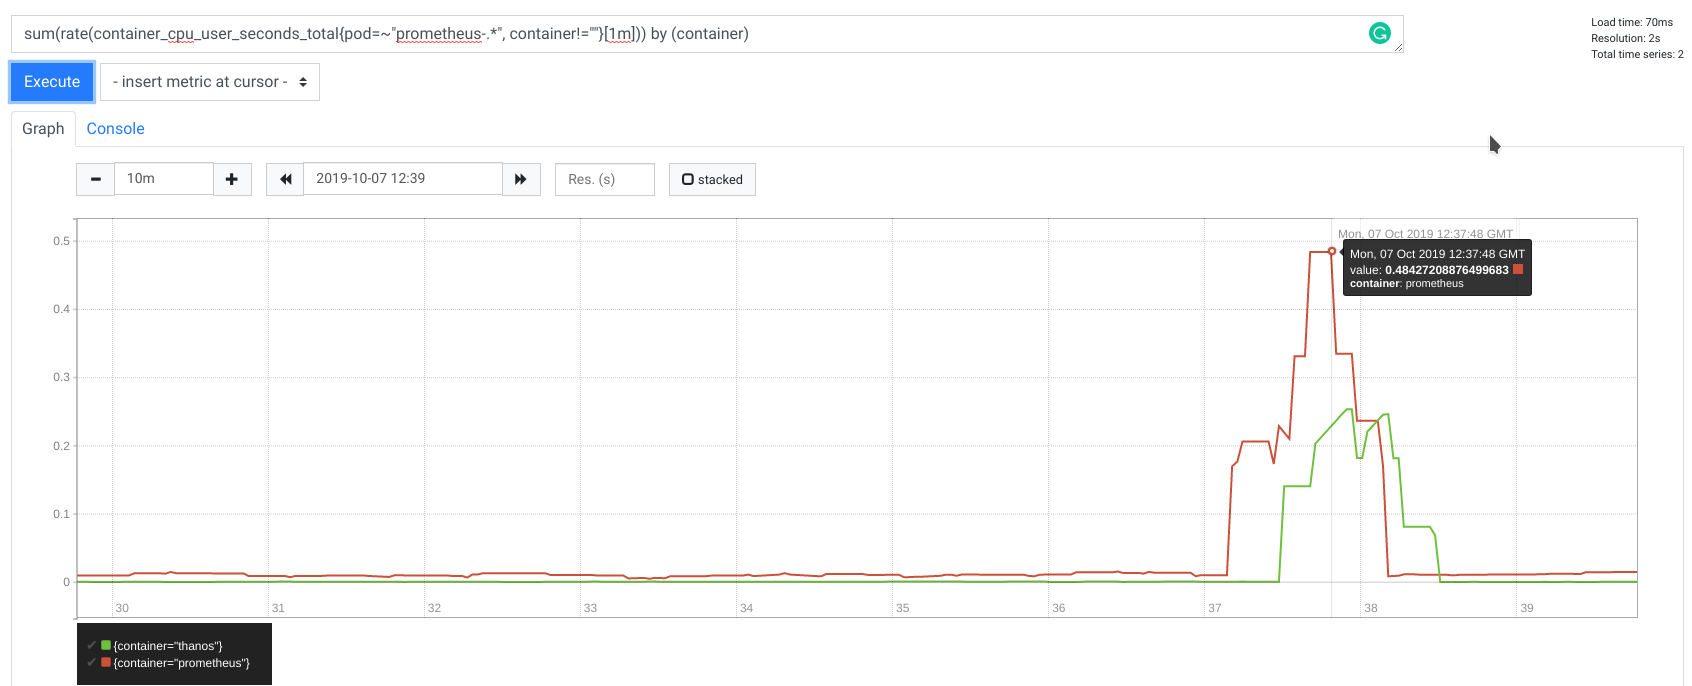
The whole response of the remote read had to be buffered in a raw, uncompressed format in order to marshsal it in a potentially huge protobuf message before sending it to the client. The whole response has to then be fully buffered in the client again to be able to unmarshal it from the received protobuf. Only after that the client was able to use raw samples.
What does it mean? It means that requests for, let's say, only 8 hours that matches 10,000 series can take up to 2.5GB of memory allocated by both client and server each!
Below is memory usage metric for both Prometheus and Thanos Sidecar (remote read client) during remote read request time:
It is worth to noting that querying 10,000 series is not a great idea, even for Prometheus native HTTP query_range endpoint,
as your browser simply will not be happy fetching, storing and rendering hundreds of megabytes of data. Additionally,
for dashboards and rendering purposes it is not practical to have that much data, as humans can't possibly read it.
That is why usually we craft queries that have no more than 20 series.
This is great, but a very common technique is to compose queries in such way that query returns aggregated 20 series, however underneath the query engine has to touch potentially thousands of series to evaluate the response (e.g when using aggregators). That is why systems like Thanos, which among other data, uses TSDB data from remote read, it's very often the case that the request is heavy.
Solution
To explain the solution to this problem, it is helpful to understand how Prometheus iterates over the data when queried.
The core concept can be shown in Querier's
Select method returned type called SeriesSet. The interface is presented below:
// SeriesSet contains a set of series.
type SeriesSet interface {
    Next() bool
    At() Series
    Err() error
}

// Series represents a single time series.
type Series interface {
    // Labels returns the complete set of labels identifying the series.
    Labels() labels.Labels
    // Iterator returns a new iterator of the data of the series.
    Iterator() SeriesIterator
}

// SeriesIterator iterates over the data of a time series.
type SeriesIterator interface {
    // At returns the current timestamp/value pair.
    At() (t int64, v float64)
    // Next advances the iterator by one.
    Next() bool
    Err() error
}
These sets of interfaces allow "streaming" flow inside the process. We no longer have to have a precomputed list of series that hold samples.
With this interface each SeriesSet.Next() implementation can fetch series on demand.
In a similar way, within each series. we can also dynamically fetch each sample respectively via SeriesIterator.Next.
With this contract, Prometheus can minimize allocated memory, because the PromQL engine can iterate over samples optimally to evaluate the query.
In the same way TSDB implements SeriesSet in a way that fetches the series optimally from blocks stored in the filesystem one by one, minimizing allocations.
This is important for the remote read API, as we can reuse the same pattern of streaming using iterators by sending to the
client a piece of the response in a form of few chunks for the single series.
Because protobuf has no native delimiting logic, we extended
proto definition to allow sending set of small protocol buffer messages instead of a single, huge one. We called
this mode STREAMED_XOR_CHUNKS remote read while old one is called SAMPLES. Extended protocol means that Prometheus
does not need to buffer the whole response anymore. Instead, it can work on each series sequentially and send a single frame per
each SeriesSet.Next or batch of SeriesIterator.Next iterations, potentially reusing the same memory pages for next series!
Now, the response of STREAMED_XOR_CHUNKS remote read is a set of Protobuf messages (frames) as presented below:
// ChunkedReadResponse is a response when response_type equals STREAMED_XOR_CHUNKS.
// We strictly stream full series after series, optionally split by time. This means that a single frame can contain
// partition of the single series, but once a new series is started to be streamed it means that no more chunks will
// be sent for previous one.
message ChunkedReadResponse {
  repeated prometheus.ChunkedSeries chunked_series = 1;
}

// ChunkedSeries represents single, encoded time series.
message ChunkedSeries {
  // Labels should be sorted.
  repeated Label labels = 1 [(gogoproto.nullable) = false];
  // Chunks will be in start time order and may overlap.
  repeated Chunk chunks = 2 [(gogoproto.nullable) = false];
}
As you can see the frame does not include raw samples anymore. That's the second improvement we did: We send in the message samples batched in chunks (see this video to learn more about chunks), which are exactly the same chunks we store in the TSDB.
We ended up with the following server algorithm:
- Parse request.
- Select metrics from TSDB.
- For all series:
- For all samples:
- Encode into chunks
- if the frame is >= 1MB; break
- Encode into chunks
- Marshal
ChunkedReadResponsemessage. - Snappy compress
- Send the message
- For all samples:
You can find full design here.
Benchmarks
How does the performance of this new approach compare to the old solution?
Let's compare remote read characteristics between Prometheus 2.12.0 and 2.13.0. As for the initial results presented
at the beginning of this article, I was using Prometheus as a server, and a Thanos sidecar as a client of remote read.
I was invoking testing remote read request by running gRPC call against Thanos sidecar using grpcurl.
Test was performed from my laptop (Lenovo X1 16GB, i7 8th) with Kubernetes in docker (using kind).
The data was artificially generated, and represents highly dynamic 10,000 series (worst case scenario).
The full test bench is available in thanosbench repo.
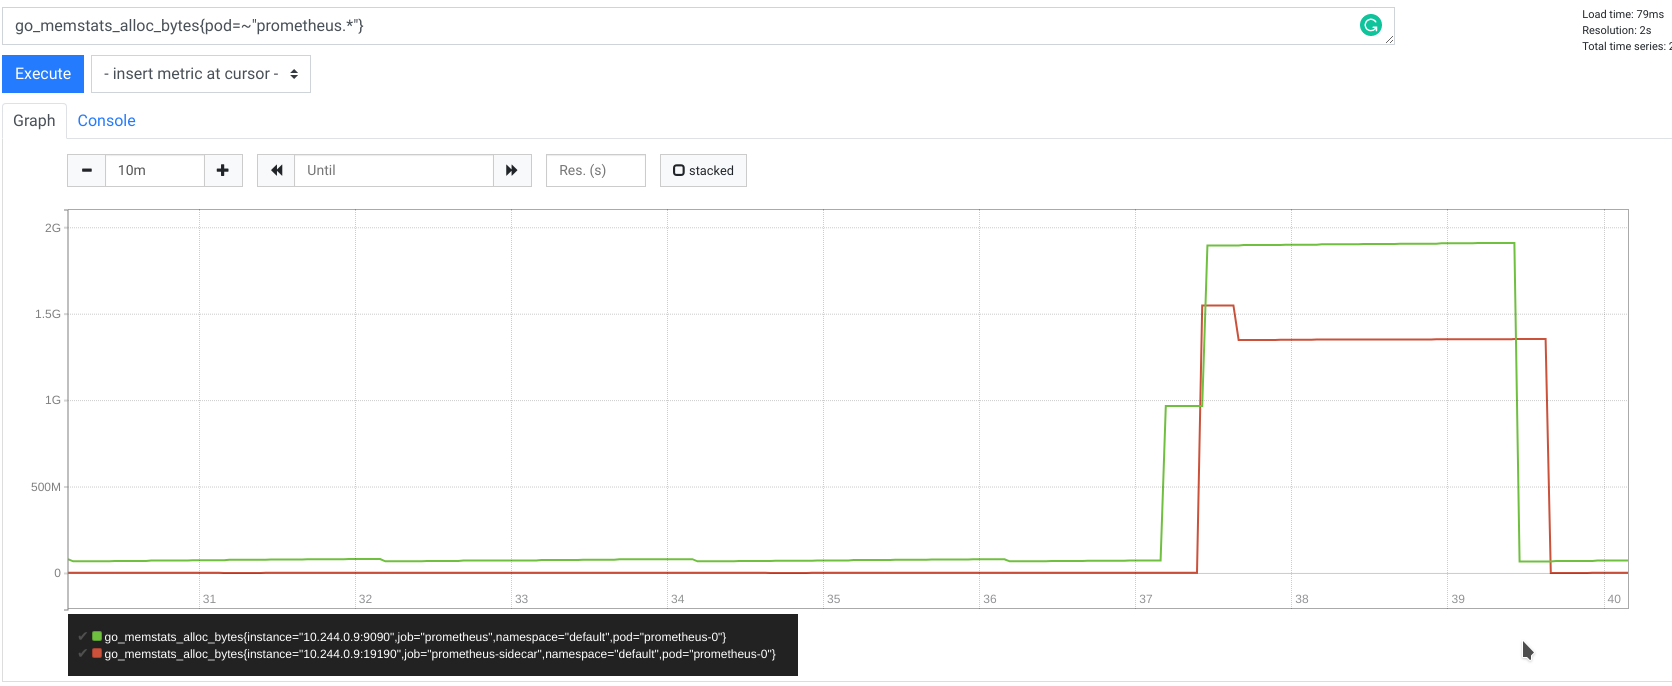
Memory
Without streaming
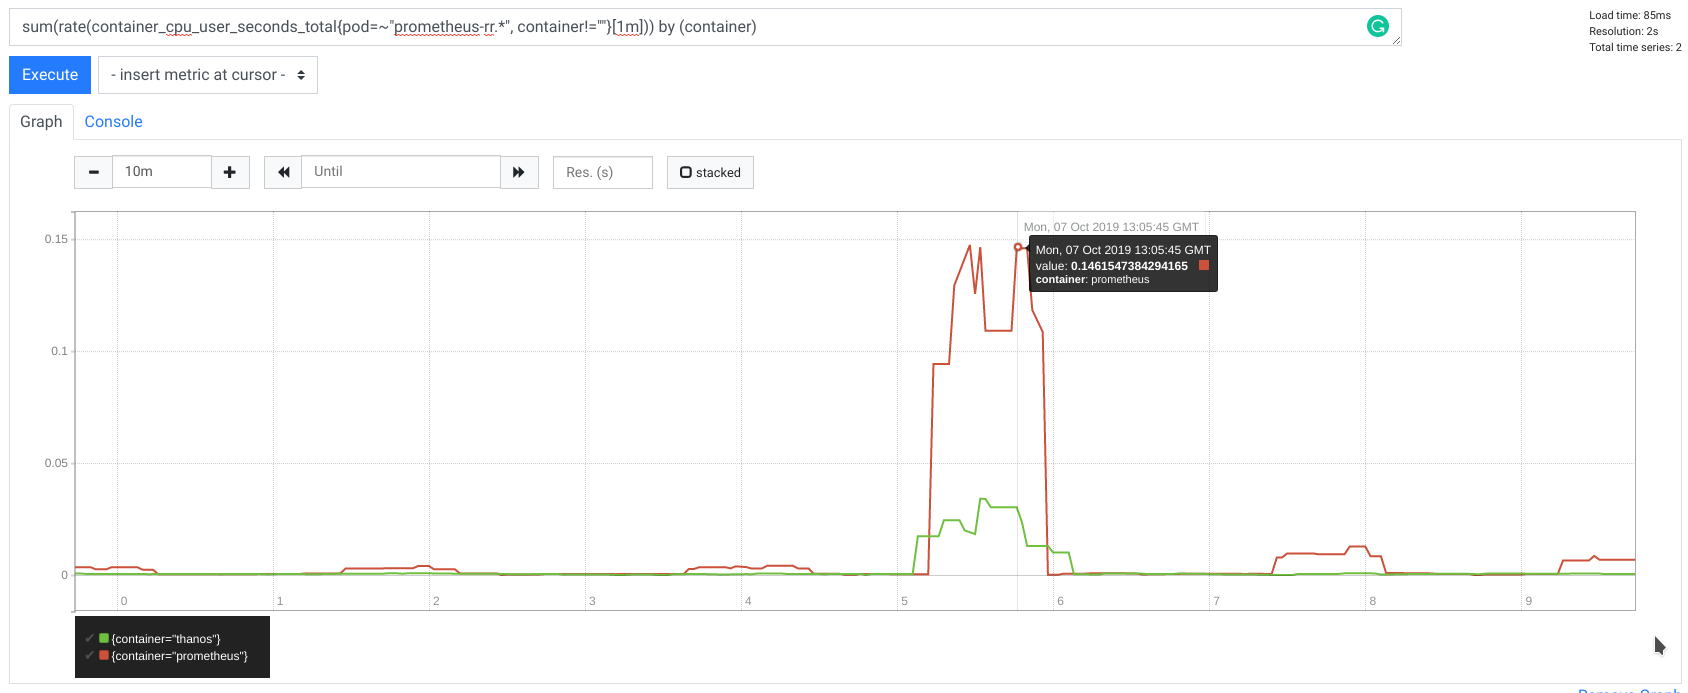
With streaming
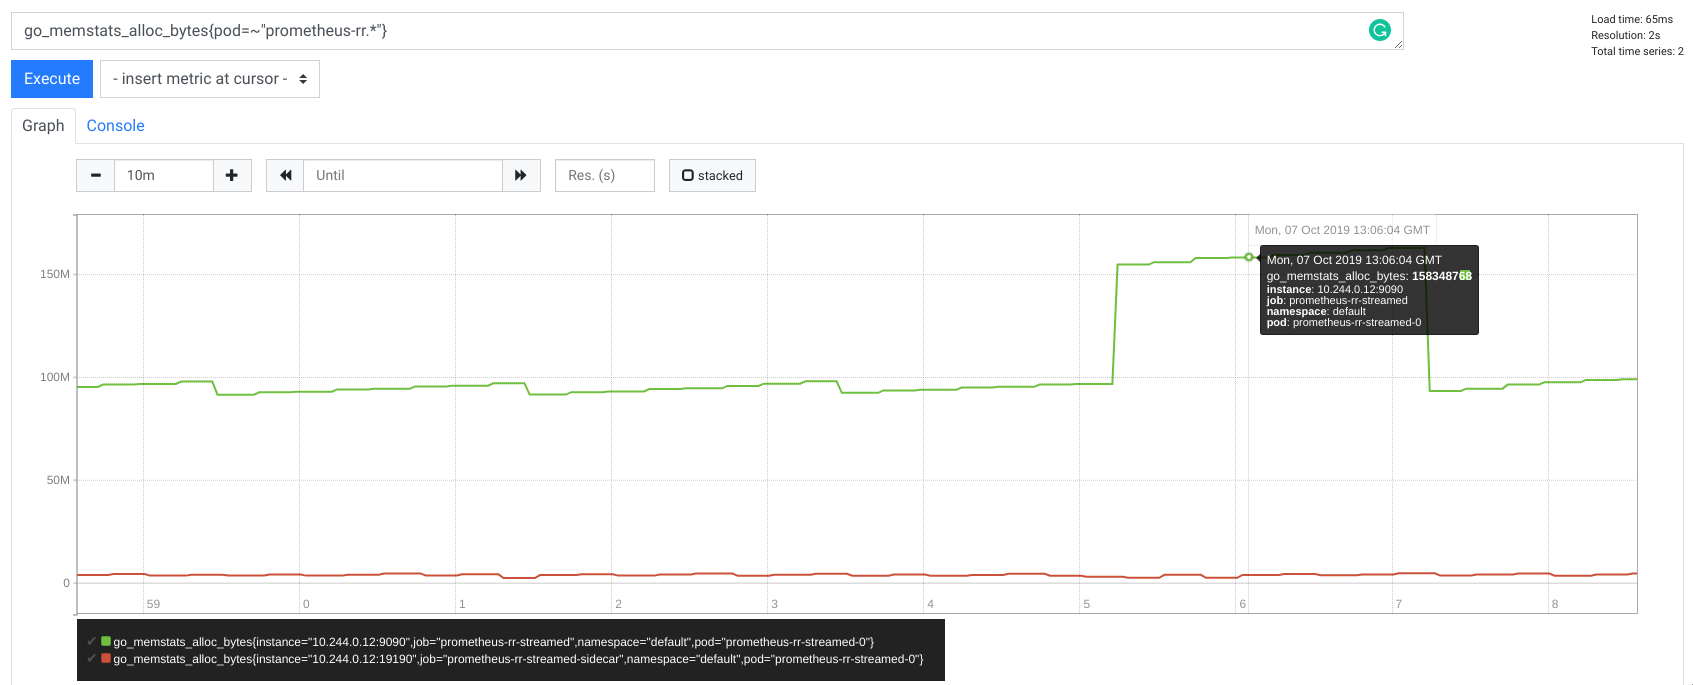
Reducing memory was the key item we aimed for with our solution. Instead of allocating GBs of memory, Prometheus buffers roughly 50MB during the whole request, whereas for Thanos there is only a marginal memory use. Thanks to the streamed Thanos gRPC StoreAPI, sidecar is now a very simple proxy.
Additionally, I tried different time ranges and number of series, but as expected I kept seeing a maximum of 50MB in allocations for Prometheus and nothing really visible for Thanos. This proves that our remote read uses constant memory per request no matter how many samples you ask for. Allocated memory per request is also drastically less influenced by the cardinality of the data, so number of series fetched like it used to be.
This allowing easier capacity planning against user traffic, with help of the concurrency limit.
CPU
Without streaming
With streaming
During my tests, CPU usage was also improved, with 2x less CPU time used.
Latency
We achieved to reduce remote read request latency as well, thanks to streaming and less encoding.
Remote read request latency for 8h range with 10,000 series:
| 2.12.0: avg time | 2.13.0: avg time | |
|---|---|---|
| real | 0m34.701s | 0m8.164s |
| user | 0m7.324s | 0m8.181s |
| sys | 0m1.172s | 0m0.749s |
And with 2h time range:
| 2.12.0: avg time | 2.13.0: avg time | |
|---|---|---|
| real | 0m10.904s | 0m4.145s |
| user | 0m6.236s | 0m4.322s |
| sys | 0m0.973s | 0m0.536s |
Additionally to the ~2.5x lower latency, the response is streamed immediately in comparison to the non-streamed
version where the client latency was 27s (real minus user time) just on processing and marshaling on Prometheus and on the Thanos side.
Compatibility
Remote read was extended in a backward and forward compatible way. This is thanks to the protobuf and accepted_response_types field which is
ignored for older servers. In the same time server works just fine if accepted_response_types is not present by older clients assuming old SAMPLES remote read.
The remote read protocol was extended in a backward and forward compatible way:
- Prometheus before v2.13.0 will safely ignore the
accepted_response_typesfield provided by newer clients and assumeSAMPLESmode. - Prometheus after v2.13.0 will default to the
SAMPLESmode for older clients that don't provide theaccepted_response_typesparameter.
Usage
To use the new, streamed remote read in Prometheus v2.13.0, a 3rd party system has to add accepted_response_types = [STREAMED_XOR_CHUNKS] to the request.
Then Prometheus will stream ChunkedReadResponse instead of old message. Each ChunkedReadResponse message is
following varint size and fixed size bigendian uint32 for CRC32 Castagnoli checksum.
For Go it is recommended to use the ChunkedReader to read directly from the stream.
Note that storage.remote.read-sample-limit flag is no longer working for STREAMED_XOR_CHUNKS.
storage.remote.read-concurrent-limit works as previously.
There also new option storage.remote.read-max-bytes-in-frame which controls the maximum size of each message. It is advised
to keep it 1MB as the default as it is recommended by Google to keep protobuf message not larger than 1MB.
As mentioned before, Thanos gains a lot with this improvement. Streamed remote read is added in v0.7.0, so this or any following version,
will use streamed remote read automatically whenever Prometheus 2.13.0 or newer is used with the Thanos sidecar.
Next Steps
Release 2.13.0 introduces extended remote read and Prometheus server side implementation, However at the moment of writing there are still few items to do in order to fully get advantage from the extended remote read protocol:
- Support for client side of Prometheus remote read: In progress
- Avoid re-encoding of chunks for blocks during remote read: In progress
Summary
To sum up, the main benefits of chunked, streaming of remote read are:
- Both client and server are capable of using practically constant memory size per request. This is because the Prometheus sends just single small frames one by one instead of the whole response during remote read. This massively helps with capacity planning, especially for a non-compressible resource like memory.
- Prometheus server does not need to decode chunks to raw samples anymore during remote read. The same for client side for encoding, if the system is reusing native TSDB XOR compression (like Thanos does).
As always, if you have any issues or feedback, feel free to submit a ticket on GitHub or ask questions on the mailing list.