Types of metrics.
Prometheus supports four types of metrics, which are - Counter - Gauge - Histogram - Summary
Counter
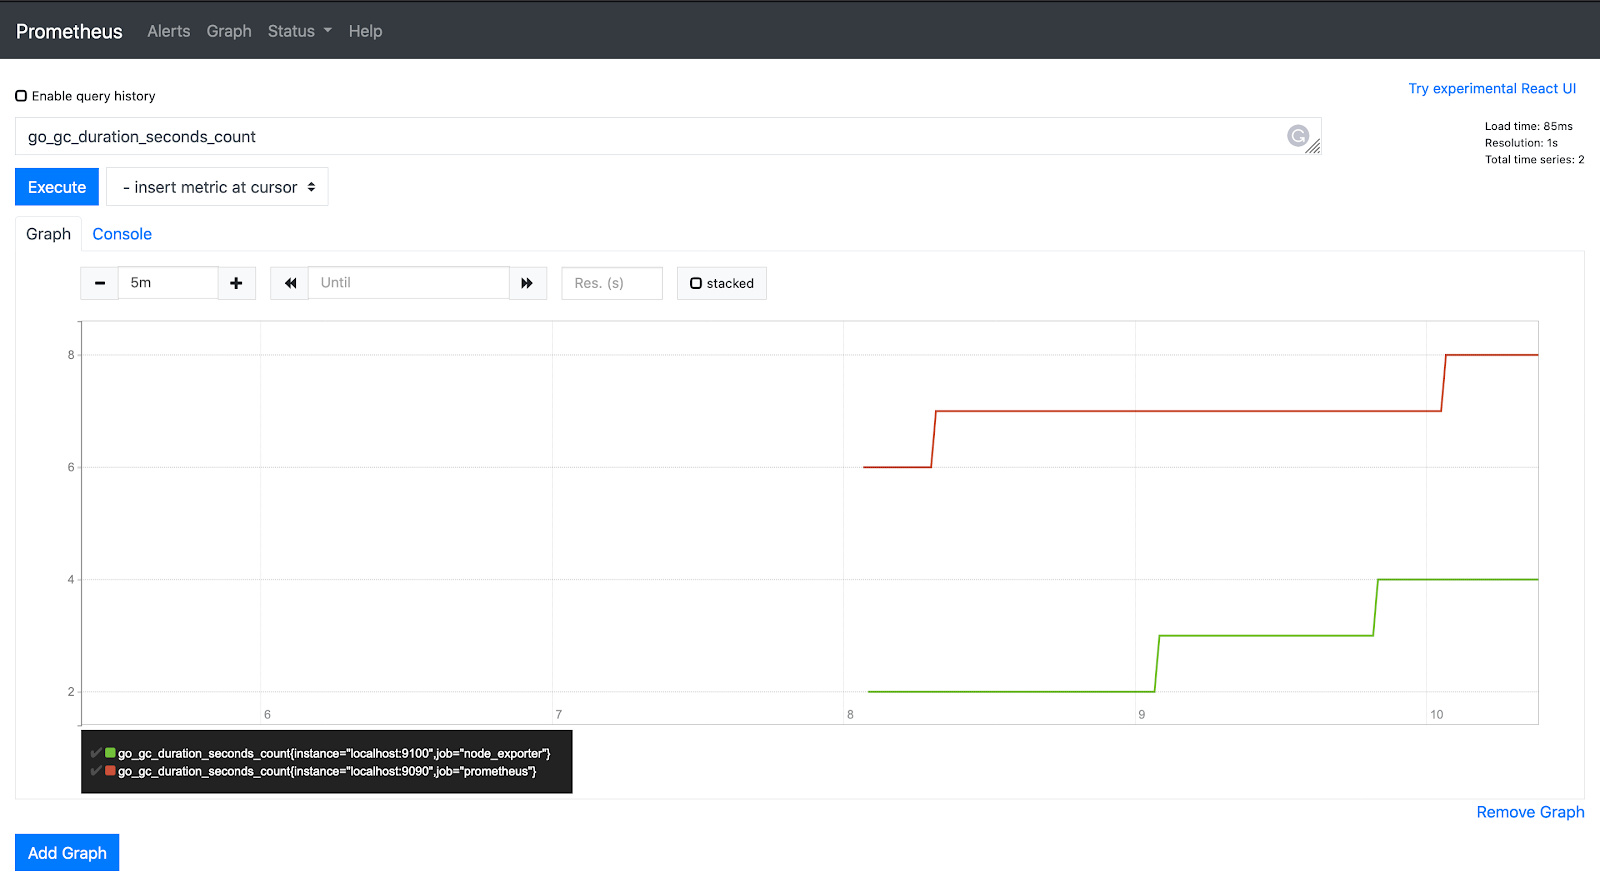
Counter is a metric value that can only increase or reset i.e. the value cannot reduce than the previous value. It can be used for metrics like the number of requests, no of errors, etc.
Type the below query in the query bar and click execute.
go_gc_duration_seconds_count
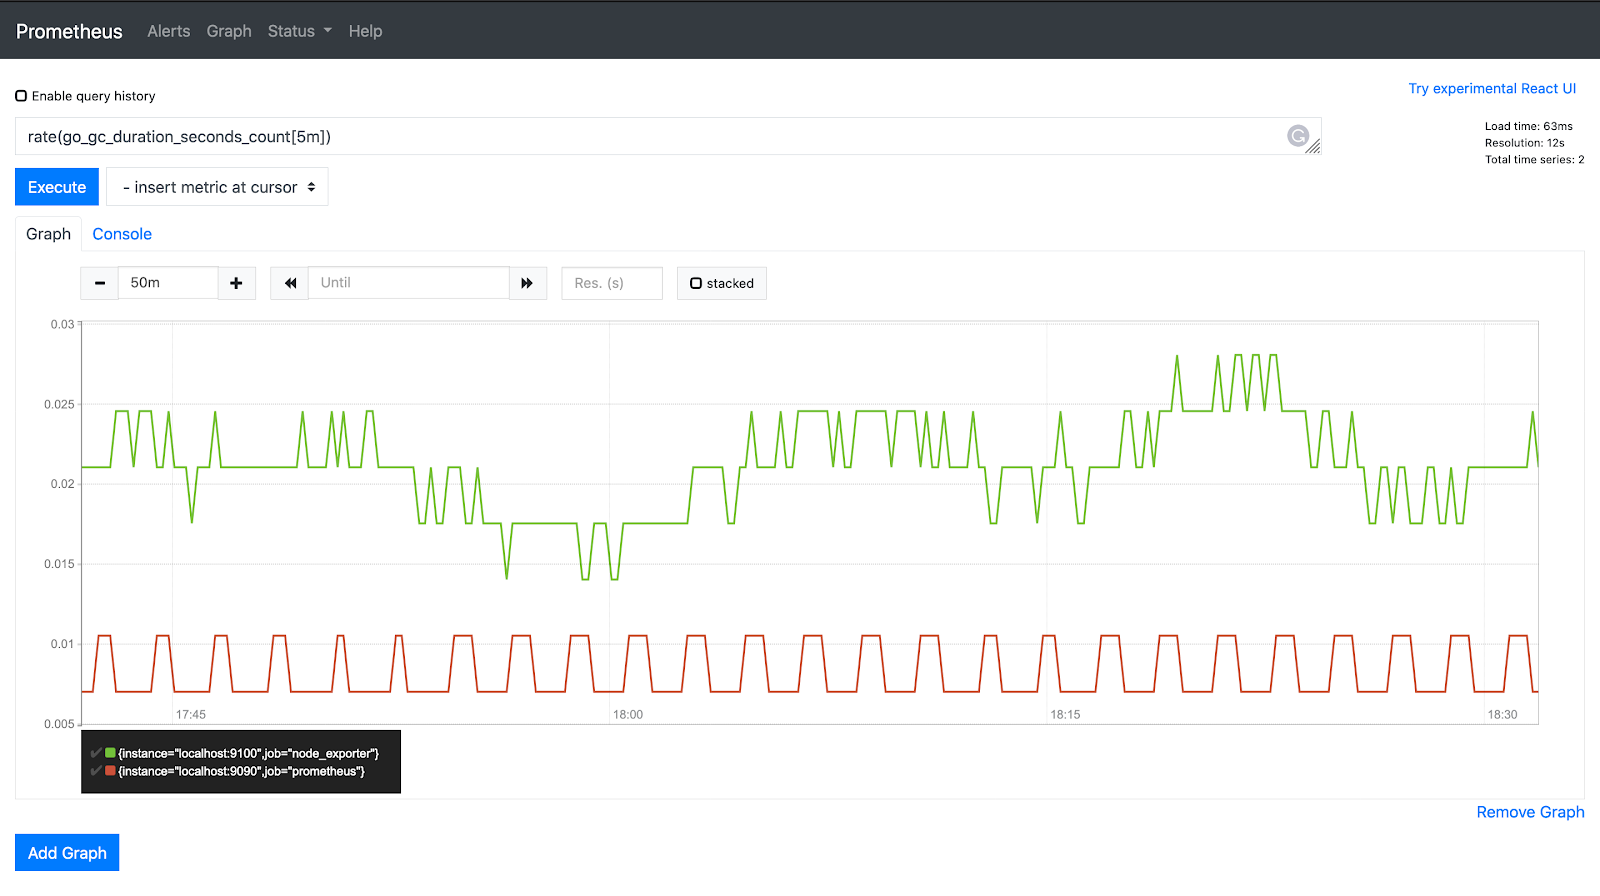
The rate() function in PromQL takes the history of metrics over a time frame and calculates how fast the value is increasing per second. Rate is applicable on counter values only.
rate(go_gc_duration_seconds_count[5m])
Gauge
Gauge is a number which can either go up or down. It can be used for metrics like the number of pods in a cluster, the number of events in a queue, etc.
go_memstats_heap_alloc_bytes

PromQL functions like max_over_time, min_over_time and avg_over_time can be used on gauge metrics
Histogram
Histogram is a more complex metric type when compared to the previous two. Histogram can be used for any calculated value which is counted based on bucket values. Bucket boundaries can be configured by the developer. A common example would be the time it takes to reply to a request, called latency.
Example: Let's assume we want to observe the time taken to process API requests. Instead of storing the request time for each request, histograms allow us to store them in buckets. We define buckets for time taken, for example lower or equal 0.3, le 0.5, le 0.7, le 1, and le 1.2. So these are our buckets and once the time taken for a request is calculated it is added to the count of all the buckets whose bucket boundaries are higher than the measured value.
Let's say Request 1 for endpoint “/ping” takes 0.25 s. The count values for the buckets will be.
/ping
| Bucket | Count |
|---|---|
| 0 - 0.3 | 1 |
| 0 - 0.5 | 1 |
| 0 - 0.7 | 1 |
| 0 - 1 | 1 |
| 0 - 1.2 | 1 |
| 0 - +Inf | 1 |
Note: +Inf bucket is added by default.
(Since the histogram is a cumulative frequency 1 is added to all the buckets that are greater than the value)
Request 2 for endpoint “/ping” takes 0.4s The count values for the buckets will be this.
/ping
| Bucket | Count |
|---|---|
| 0 - 0.3 | 1 |
| 0 - 0.5 | 2 |
| 0 - 0.7 | 2 |
| 0 - 1 | 2 |
| 0 - 1.2 | 2 |
| 0 - +Inf | 2 |
Since 0.4 is below 0.5, all buckets up to that boundary increase their counts.
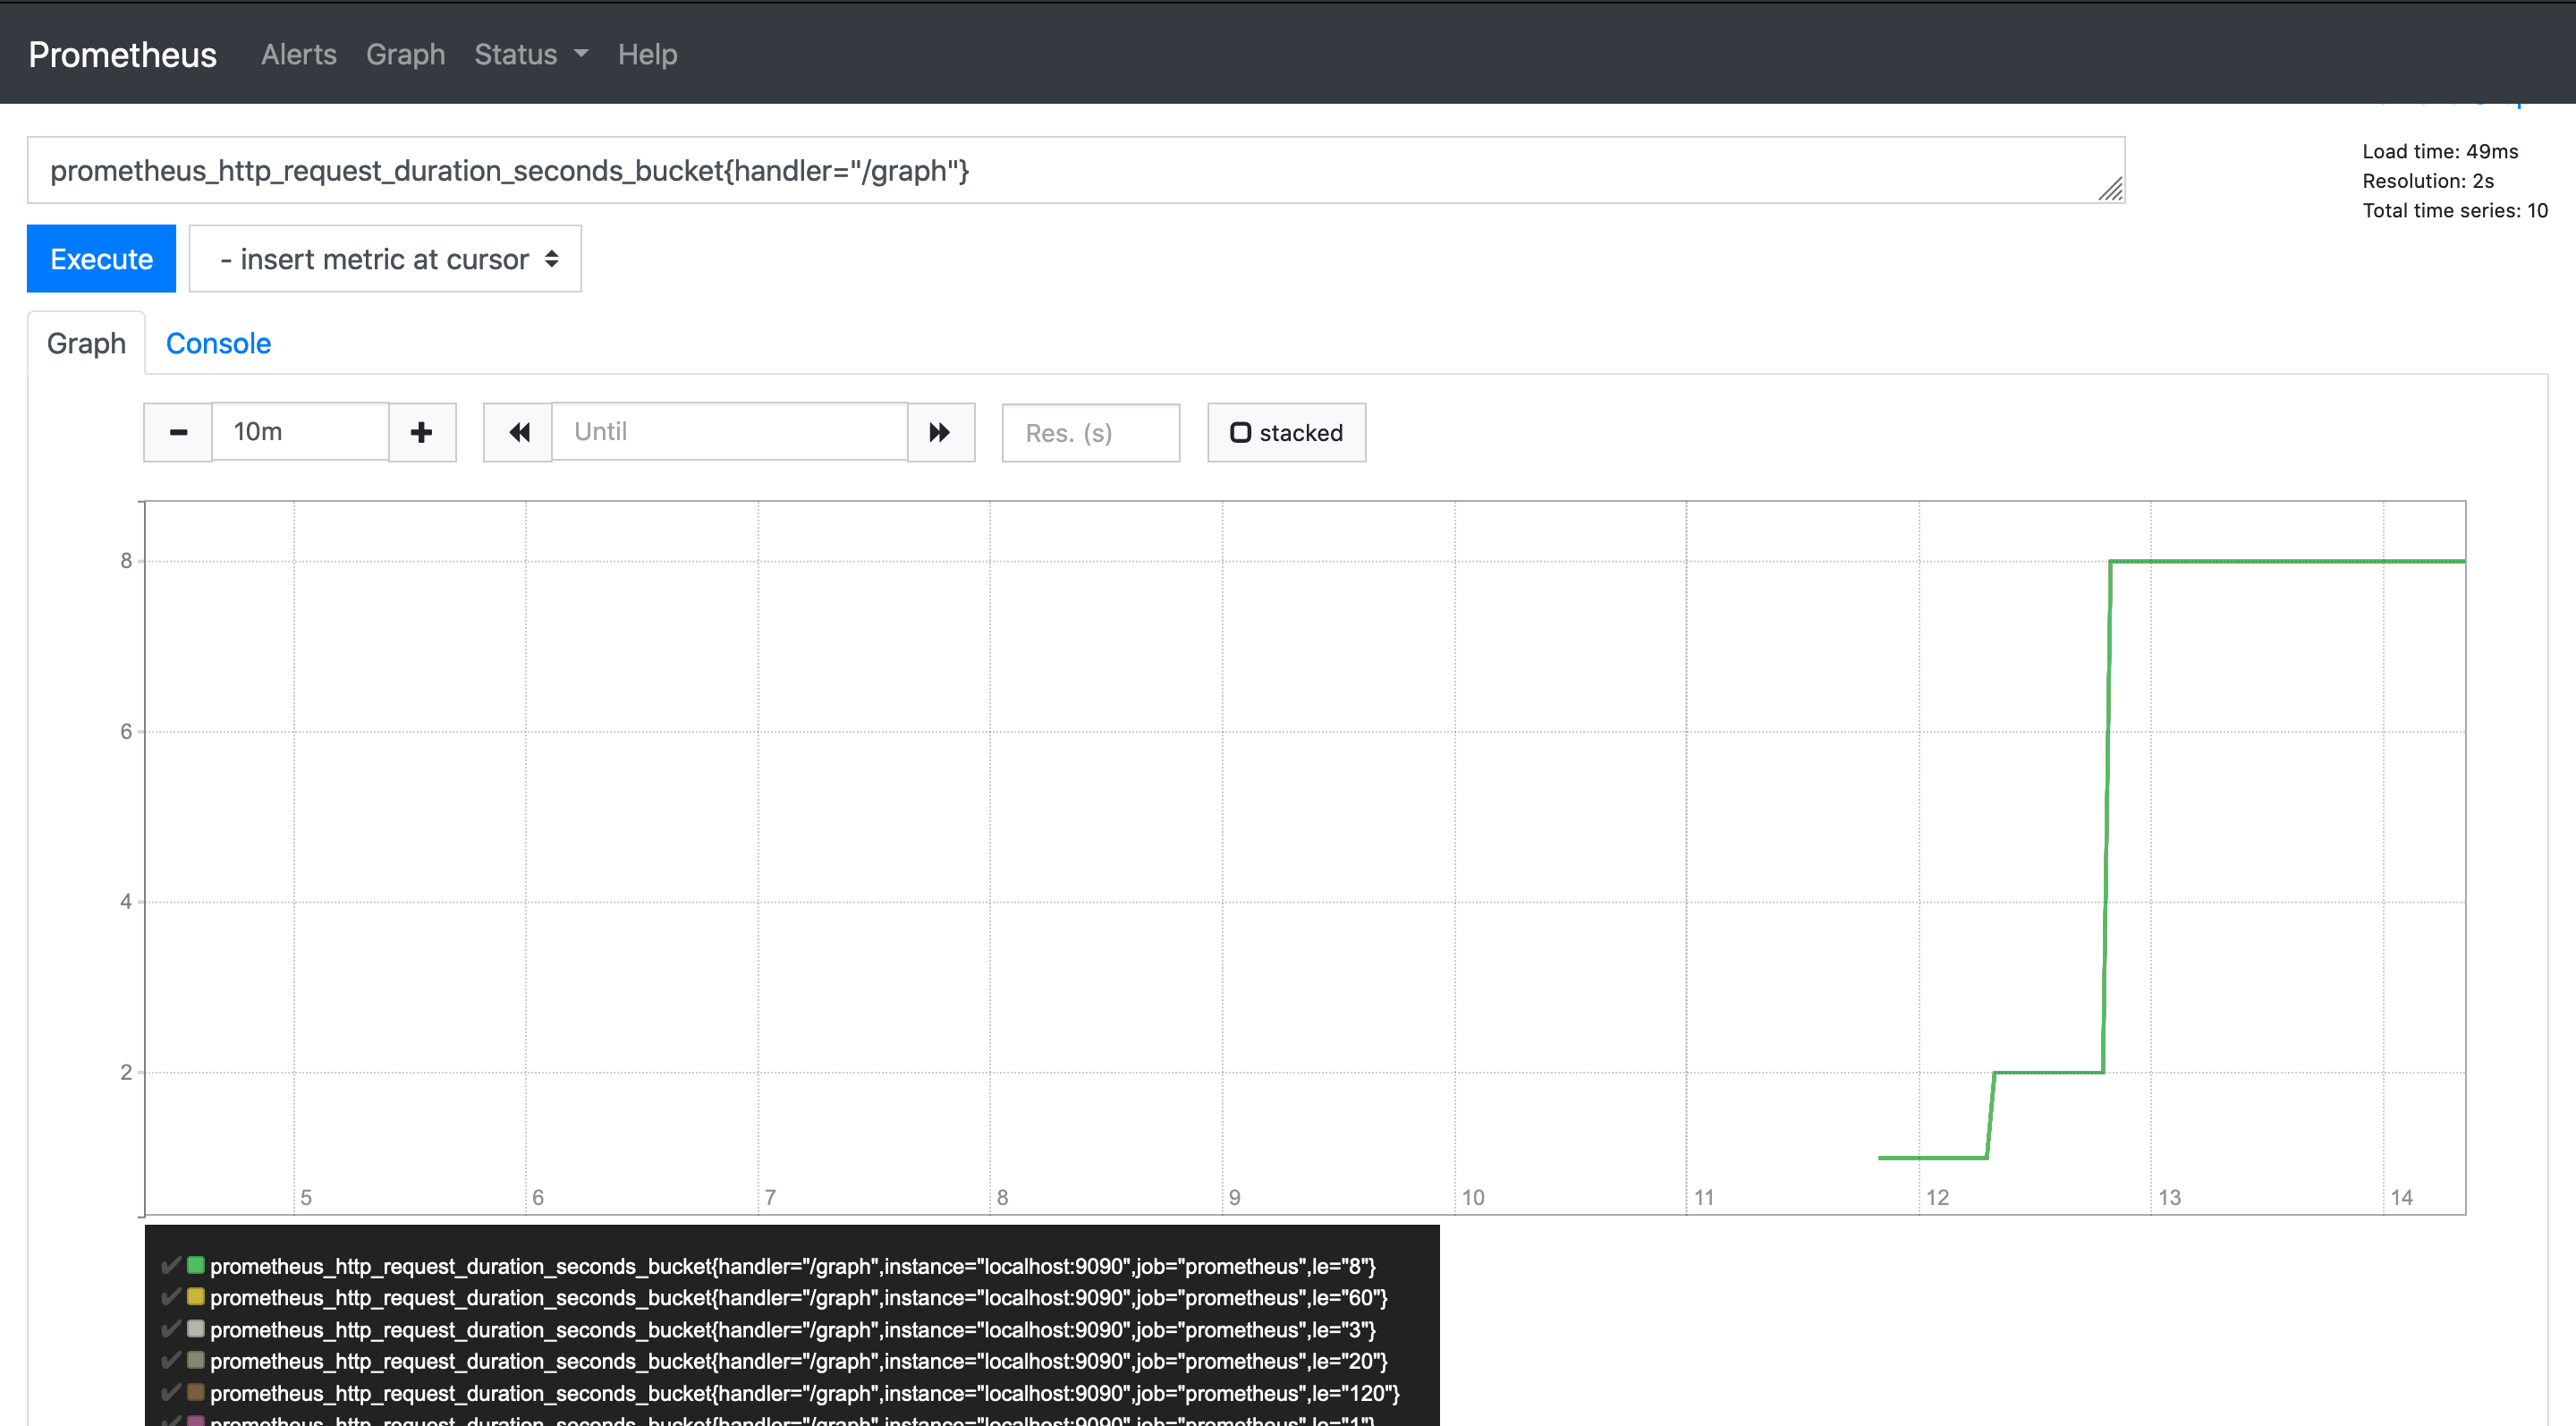
Let's explore a histogram metric from the Prometheus UI and apply a few functions.
prometheus_http_request_duration_seconds_bucket{handler="/graph"}
histogram_quantile() function can be used to calculate quantiles from a histogram
histogram_quantile(0.9,prometheus_http_request_duration_seconds_bucket{handler="/graph"})
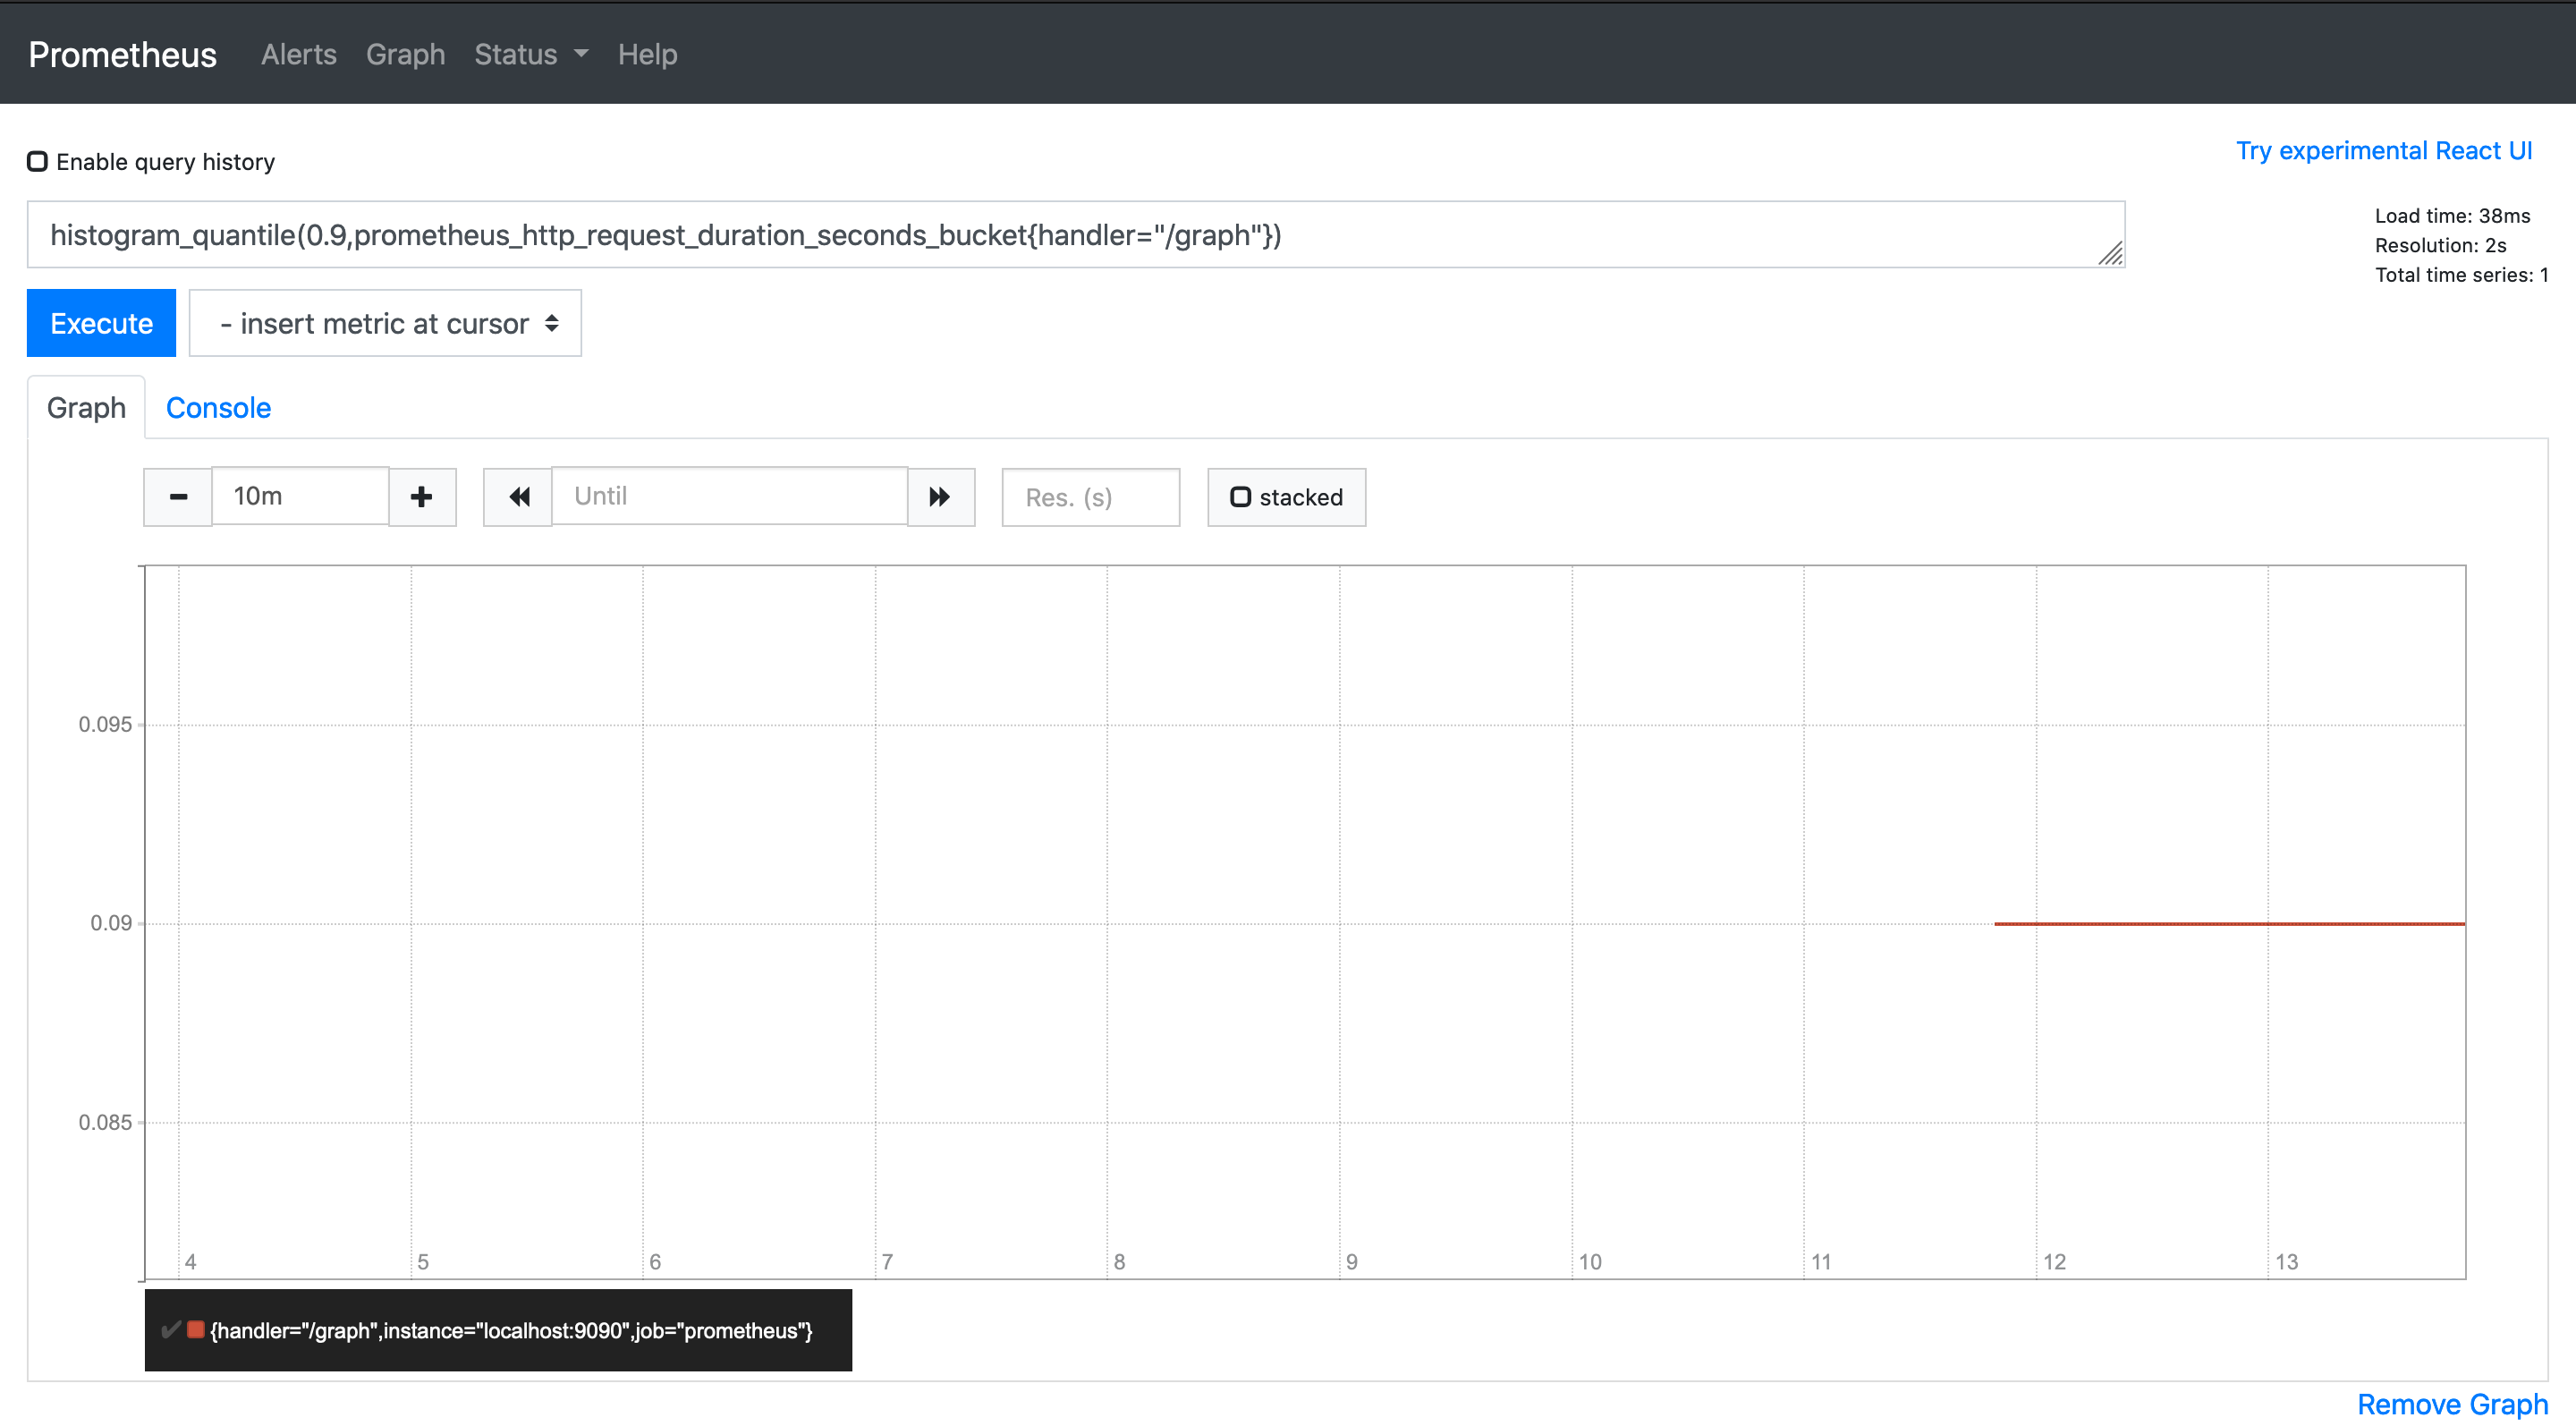
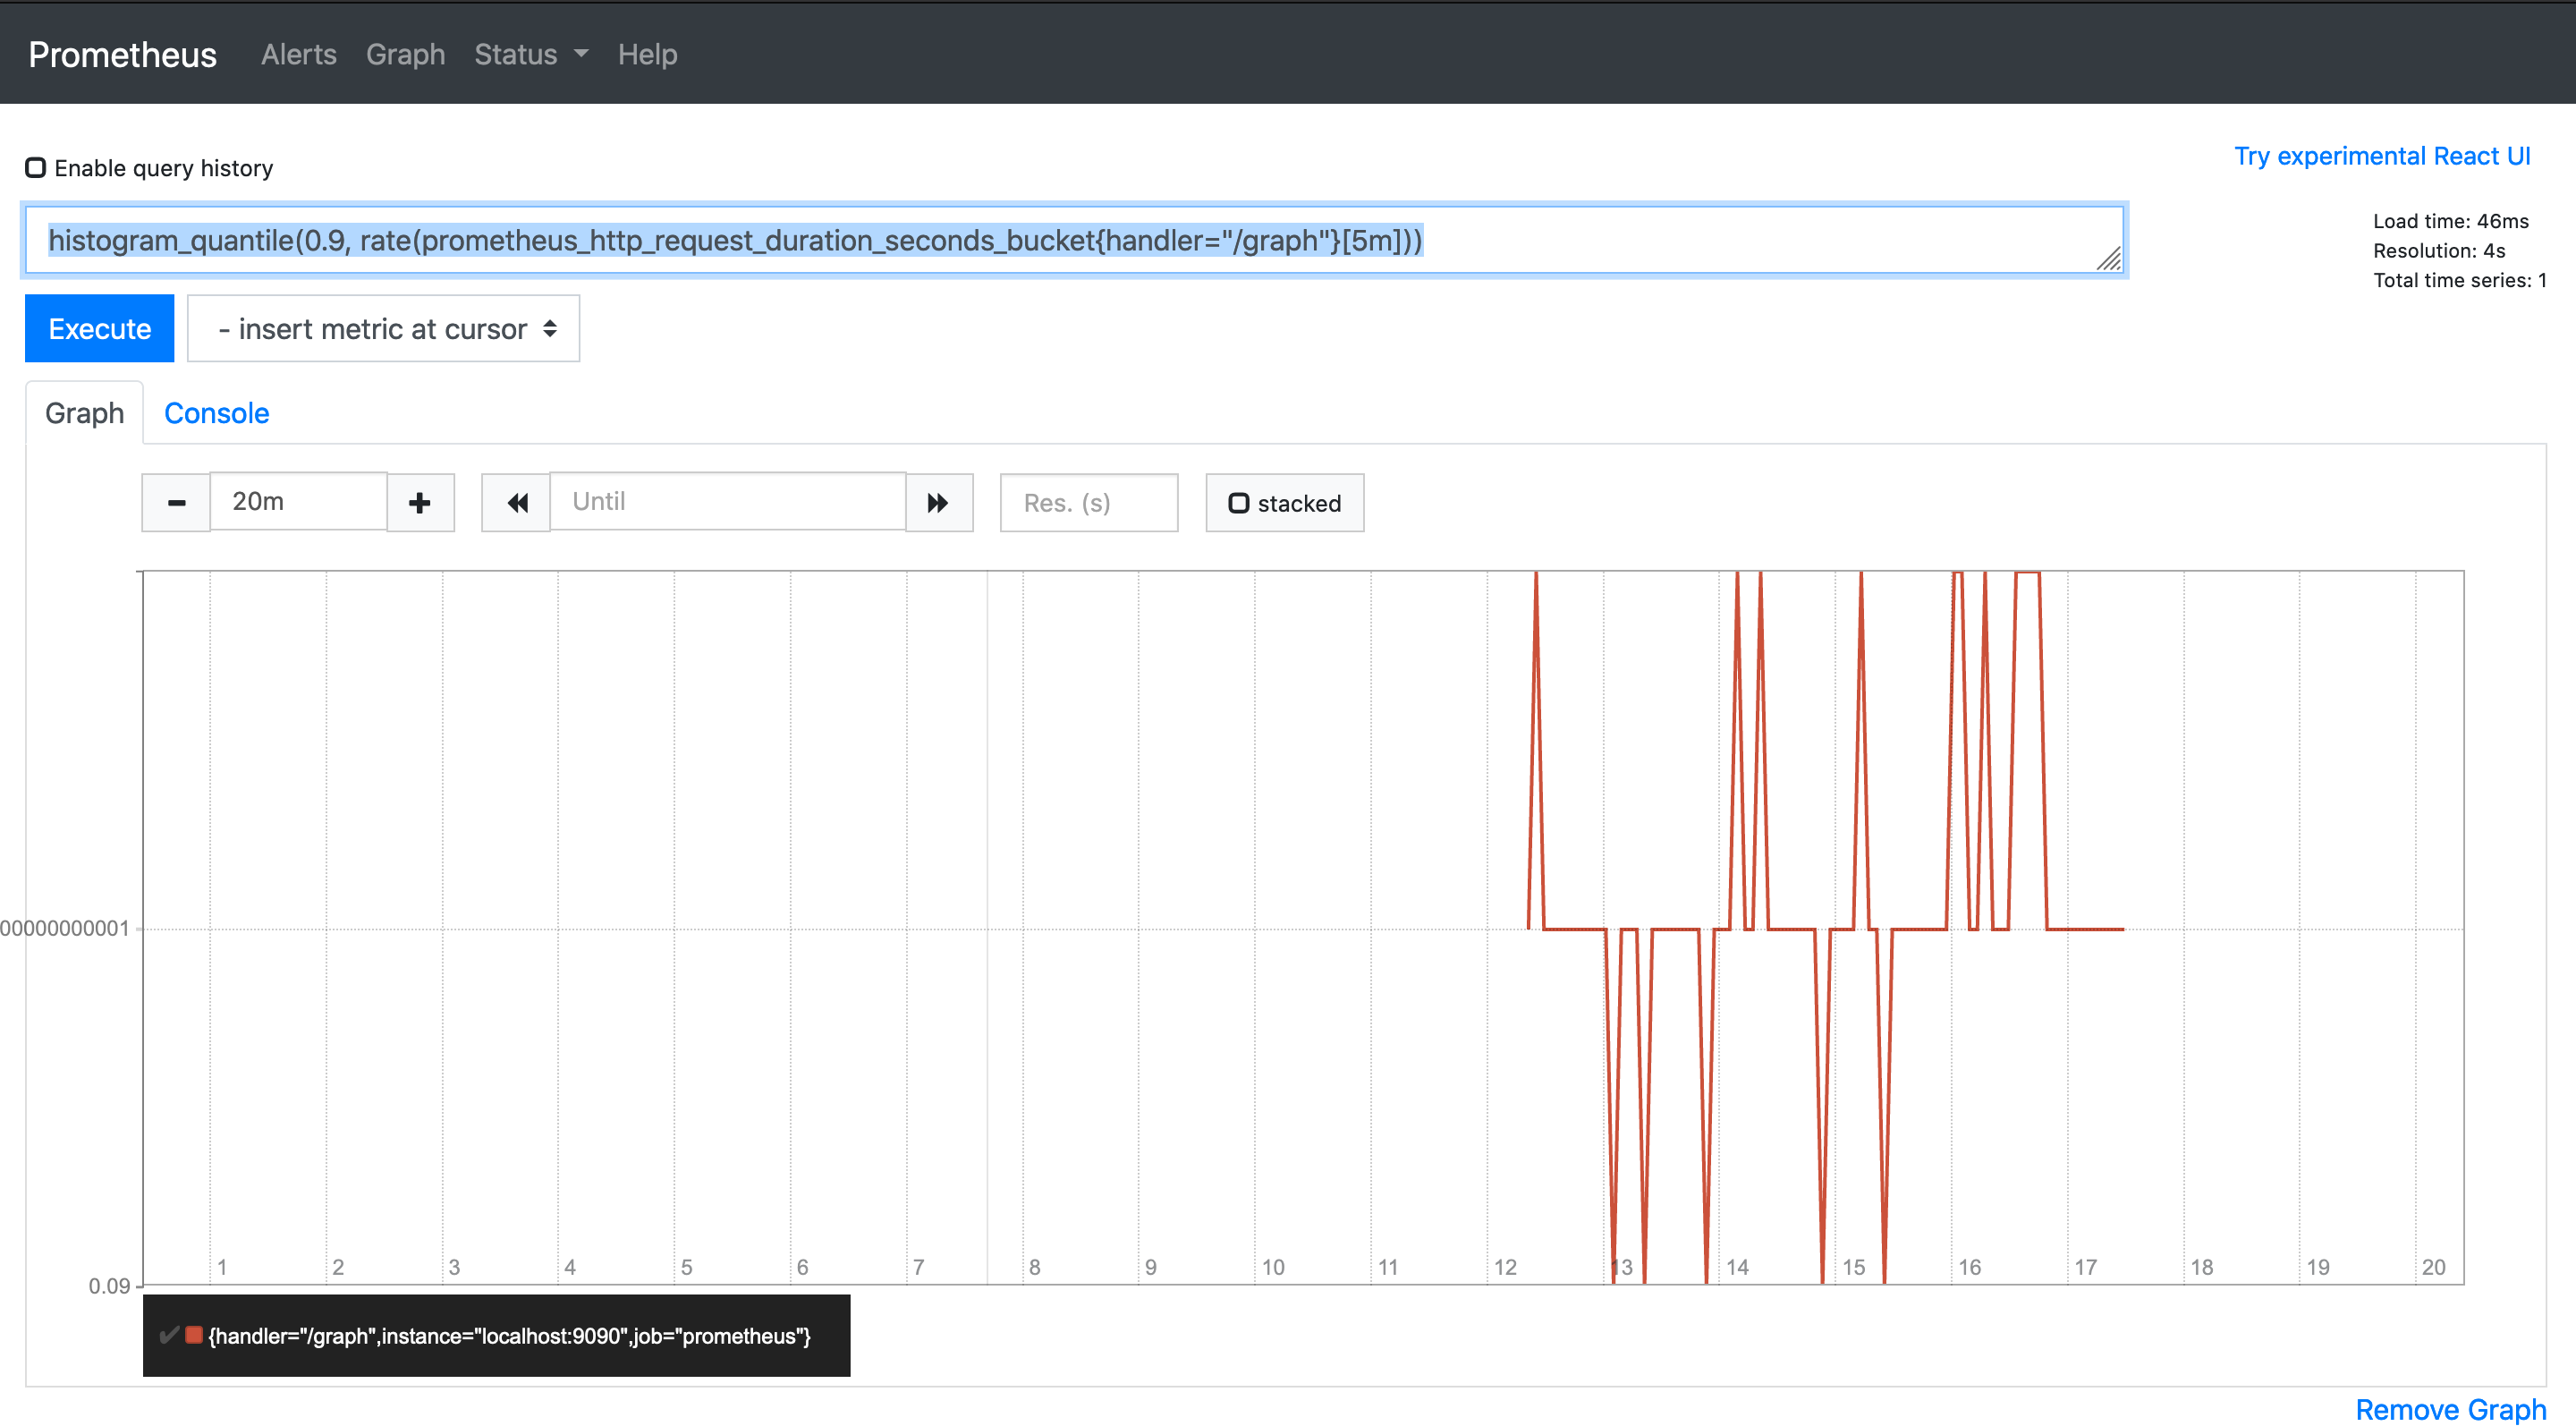
The graph shows that the 90th percentile is 0.09, To find the histogram_quantile over the last 5m you can use the rate() and time frame
histogram_quantile(0.9, rate(prometheus_http_request_duration_seconds_bucket{handler="/graph"}[5m]))
Summary
Summaries also measure events and are an alternative to histograms. They are cheaper but lose more data. They are calculated on the application level hence aggregation of metrics from multiple instances of the same process is not possible. They are used when the buckets of a metric are not known beforehand, but it is highly recommended to use histograms over summaries whenever possible.
In this tutorial, we covered the types of metrics in detail and a few PromQL operations like rate, histogram_quantile, etc.
This documentation is open-source. Please help improve it by filing issues or pull requests.