The beginning
A year ago today, we officially announced Prometheus to the wider world. This is a great opportunity for us to look back and share some of the wonderful things that have happened to the project since then. But first, let's start at the beginning.
Although we had already started Prometheus as an open-source project on GitHub in 2012, we didn't make noise about it at first. We wanted to give the project time to mature and be able to experiment without friction. Prometheus was gradually introduced for production monitoring at SoundCloud in 2013 and then saw more and more usage within the company, as well as some early adoption by our friends at Docker and Boxever in 2014. Over the years, Prometheus was growing more and more mature and although it was already solving people's monitoring problems, it was still unknown to the wider public.
Going public
Everything changed for us a year ago, in January of 2015. After more than two years of development and internal usage, we felt that Prometheus was ready for a wider audience and decided to go fully public with our official announcement blog post, a website, and a series of related posts. We already received a good deal of attention during the first week after the announcement, but nothing could prepare us for what happened a week later: someone unknown to us (hello there, jjwiseman!) had submitted the Prometheus website to Hacker News and somehow their post had made it all the way to the top.
This is when things started going slightly crazy in a good way. We saw a sharp rise in contributors, mailing list questions, GitHub issues, IRC visitors, requests for conference and meetup talks, and increasing buzz on the net in general. Since the beginning, we have been very lucky about the quality of our newly expanded community: The kind of people who were attracted to Prometheus also turned out to be very competent, constructive, and high-quality contributors and users. The ideal open-source scenario of receiving a lot of value back from the community was a reality pretty much from day one.
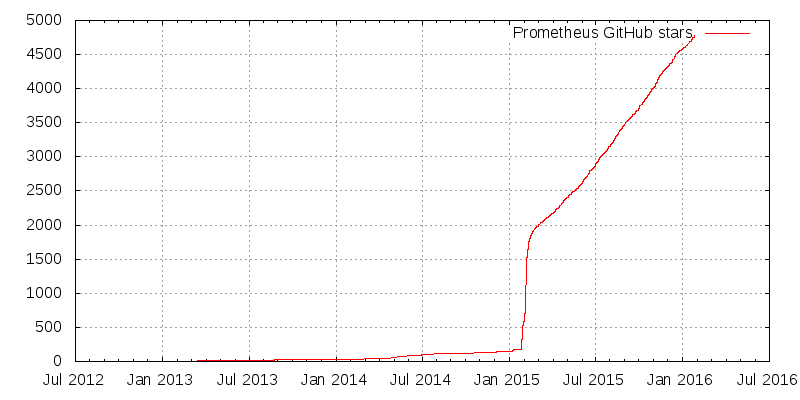
What does all that Hacker News buzz look like in terms of GitHub stars? Try and see if you can find the exact moment in this graph (ironically, a Gnuplot and not Prometheus graph) when we went out of "dark mode" and got hit by Hacker News:
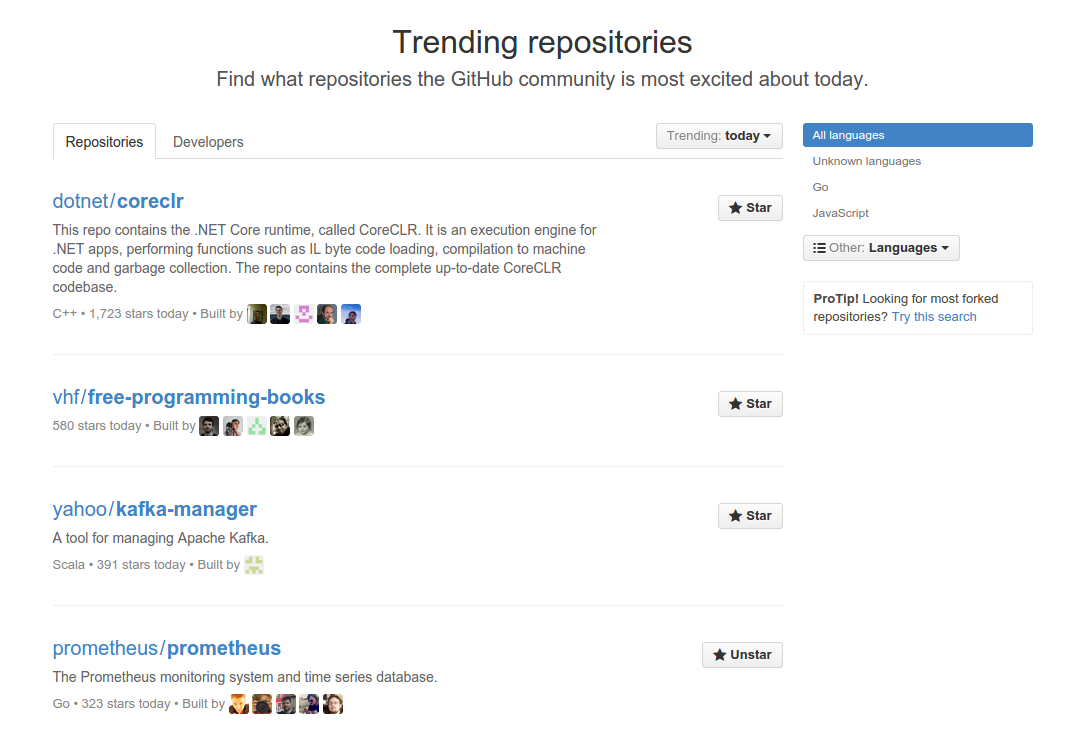
This attention also put us in the 4th place of GitHub's trending repositories worldwide:
After the first wave
After those first weeks, the initial onslaught of incoming communication cooled down a bit, but we were and still are receiving constantly growing adoption.
To give you an idea of the ecosystem, we now have:
- 33 repositories in our GitHub organization
- ~4800 total GitHub stars
- 200+ contributors
- 2300+ pull requests (60+ open)
- 1100+ issues (300+ open)
- 150+ people in our IRC channel (
#prometheuson FreeNode) - 250+ people on the mailing list who have created 300+ threads
- 20+ Prometheus-related talks and workshops
- 100+ articles and blog posts
Besides countless smaller features and bug fixes to existing projects, the community has contributed many projects of their own to the Prometheus ecosystem. Most of them are exporters that translate metrics from existing systems into Prometheus's data model, but there have also been important additions to Prometheus itself, such as service discovery mechanisms for Kubernetes, Marathon and EC2.
Shortly after making more noise about Prometheus, we also found one contributor (Fabian) so outstanding that he ended up joining SoundCloud to work on Prometheus. He has since become the most active developer on the project and we have him to thank for major new features such as generalized service discovery support, runtime-reloadable configurations, new powerful query language features, a custom-built query parser, and so much more. He is currently working on the new beta rewrite of the Alertmanager.
Finally, we have been honored to be recognized and adopted by major players in the industry. Google is now instrumenting its open-source container management system Kubernetes natively with Prometheus metrics. CoreOS is picking it up for etcd's monitoring as well. DigitalOcean is betting on Prometheus for their internal monitoring. By now, the list of companies using Prometheus in one way or another has become too long to mention all of them: Google, CoreOS, Docker, Boxever, DigitalOcean, Financial Times, Improbable, KPMG, and many more. Even the world's largest digital festival, DreamHack, has used Prometheus to keep tabs on their network infrastructure in 2015, and FOSDEM will do so in 2016.
The widely popular dashboard builder Grafana also added native Prometheus backend support in version 2.5. Since people all around the world are already using and loving Grafana, we are going to focus on improving Grafana's Prometheus integration and will invest less energy in our own dashboard builder PromDash in the future.
With the Prometheus ecosystem continuing to grow, the first users have started asking about commercial support. While Prometheus will always remain an independent open source project, one of our core contributors (Brian Brazil) has recently founded his own company, Robust Perception, which provides support and consulting services around Prometheus and monitoring in general.
On a lighter note, 2015 has also been the year in which Brian proved Prometheus's query language to be Turing complete by implementing Conway's Game of Life in PromQL.
The road ahead
Both personally and technically, we are really excited about what has happened last year in Prometheus-land. We love the opportunity to provide the world with a powerful new approach to monitoring, especially one that is much better suited towards modern cloud- and container-based infrastructures than traditional solutions. We are also very grateful to all contributors and hope to continuously improve Prometheus for everyone.
Although Prometheus is relatively mature by now, we have a list of major goals we want to tackle in 2016. The highlights will be polishing the new Alertmanager rewrite, supporting full read and write integration for external long-term storage, as well as eventually releasing a stable 1.0 version of the Prometheus server itself.
Stay tuned!