Continuing our series of interviews with users of Prometheus, Compose talks about their monitoring journey from Graphite and InfluxDB to Prometheus.
Can you tell us about yourself and what Compose does?
Compose delivers production-ready database clusters as a service to developers around the world. An app developer can come to us and in a few clicks have a multi-host, highly available, automatically backed up and secure database ready in minutes. Those database deployments then autoscale up as demand increases so a developer can spend their time on building their great apps, not on running their database.
We have tens of clusters of hosts across at least two regions in each of AWS, Google Cloud Platform and SoftLayer. Each cluster spans availability zones where supported and is home to around 1000 highly-available database deployments in their own private networks. More regions and providers are in the works.
What was your pre-Prometheus monitoring experience?
Before Prometheus, a number of different metrics systems were tried. The first system we tried was Graphite, which worked pretty well initially, but the sheer volume of different metrics we had to store, combined with the way Whisper files are stored and accessed on disk, quickly overloaded our systems. While we were aware that Graphite could be scaled horizontally relatively easily, it would have been an expensive cluster. InfluxDB looked more promising so we started trying out the early-ish versions of that and it seemed to work well for a good while. Goodbye Graphite.
The earlier versions of InfluxDB had some issues with data corruption occasionally. We semi-regularly had to purge all of our metrics. It wasn’t a devastating loss for us normally, but it was irritating. The continued promises of features that never materialised frankly wore on us.
Why did you decide to look at Prometheus?
It seemed to combine better efficiency with simpler operations than other options.
Pull-based metric gathering puzzled us at first, but we soon realised the benefits. Initially it seemed like it could be far too heavyweight to scale well in our environment where we often have several hundred containers with their own metrics on each host, but by combining it with Telegraf, we can arrange to have each host export metrics for all its containers (as well as its overall resource metrics) via a single Prometheus scrape target.
How did you transition?
We are a Chef shop so we spun up a largish instance with a big EBS volume and then reached right for a community chef cookbook for Prometheus.
With Prometheus up on a host, we wrote a small Ruby script that uses the Chef
API to query for all our hosts, and write out a Prometheus target config file.
We use this file with a file_sd_config to ensure all hosts are discovered and
scraped as soon as they register with Chef. Thanks to Prometheus’ open
ecosystem, we were able to use Telegraf out of the box with a simple config to
export host-level metrics directly.
We were testing how far a single Prometheus would scale and waiting for it to fall over. It didn’t! In fact it handled the load of host-level metrics scraped every 15 seconds for around 450 hosts across our newer infrastructure with very little resource usage.
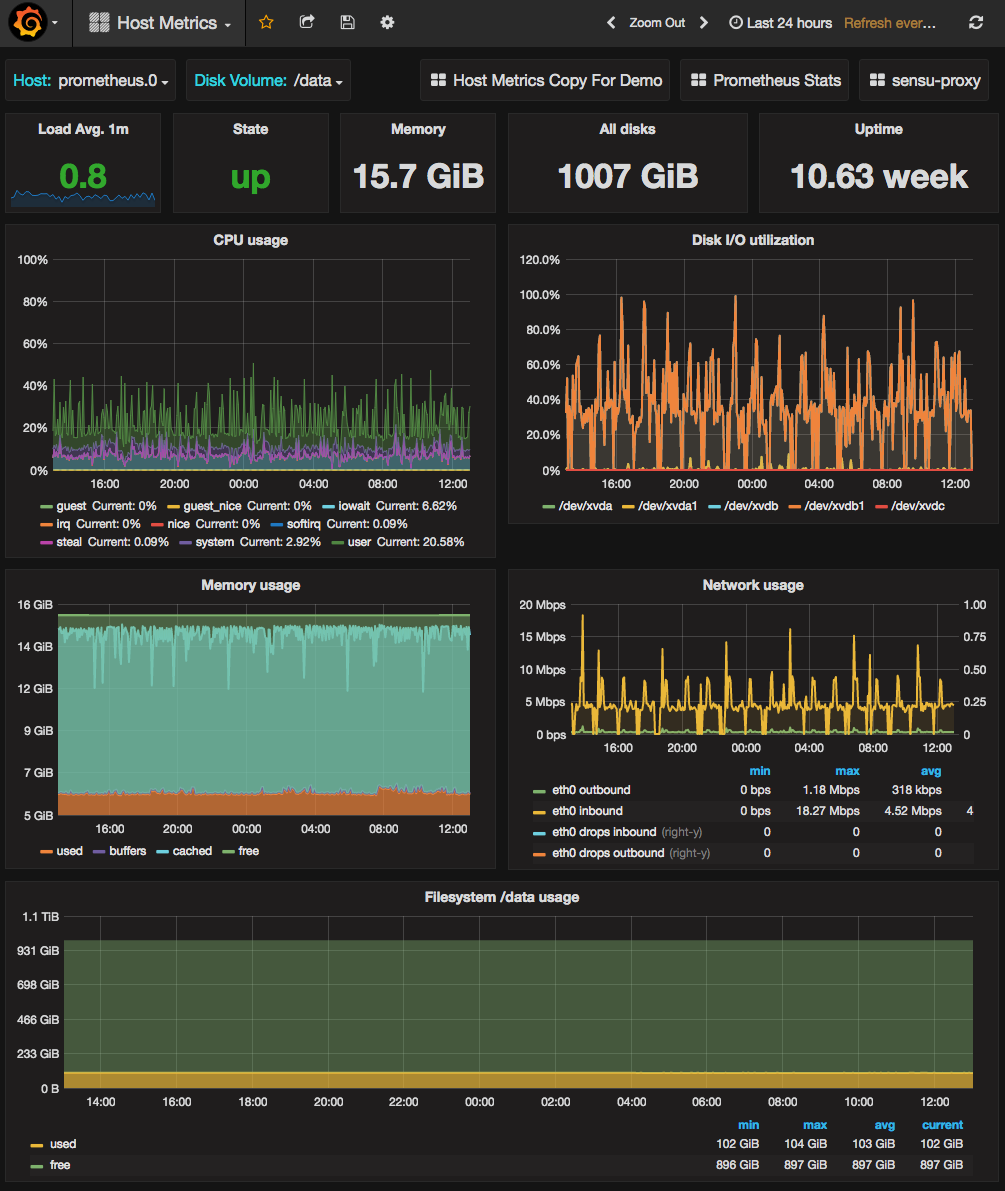
We have a lot of containers on each host so we were expecting to have to start to shard Prometheus once we added all memory usage metrics from those too, but Prometheus just kept on going without any drama and still without getting too close to saturating its resources. We currently monitor over 400,000 distinct metrics every 15 seconds for around 40,000 containers on 450 hosts with a single m4.xlarge prometheus instance with 1TB of storage. You can see our host dashboard for this host below. Disk IO on the 1TB gp2 SSD EBS volume will probably be the limiting factor eventually. Our initial guess is well over-provisioned for now, but we are growing fast in both metrics gathered and hosts/containers to monitor.
At this point the Prometheus server we’d thrown up to test with was vastly more reliable than the InfluxDB cluster we had doing the same job before, so we did some basic work to make it less of a single-point-of-failure. We added another identical node scraping all the same targets, then added a simple failover scheme with keepalived + DNS updates. This was now more highly available than our previous system so we switched our customer-facing graphs to use Prometheus and tore down the old system.
What improvements have you seen since switching?
Our previous monitoring setup was unreliable and difficult to manage. With Prometheus we have a system that’s working well for graphing lots of metrics, and we have team members suddenly excited about new ways to use it rather than wary of touching the metrics system we used before.
The cluster is simpler too, with just two identical nodes. As we grow, we know we’ll have to shard the work across more Prometheus hosts and have considered a few ways to do this.
What do you think the future holds for Compose and Prometheus?
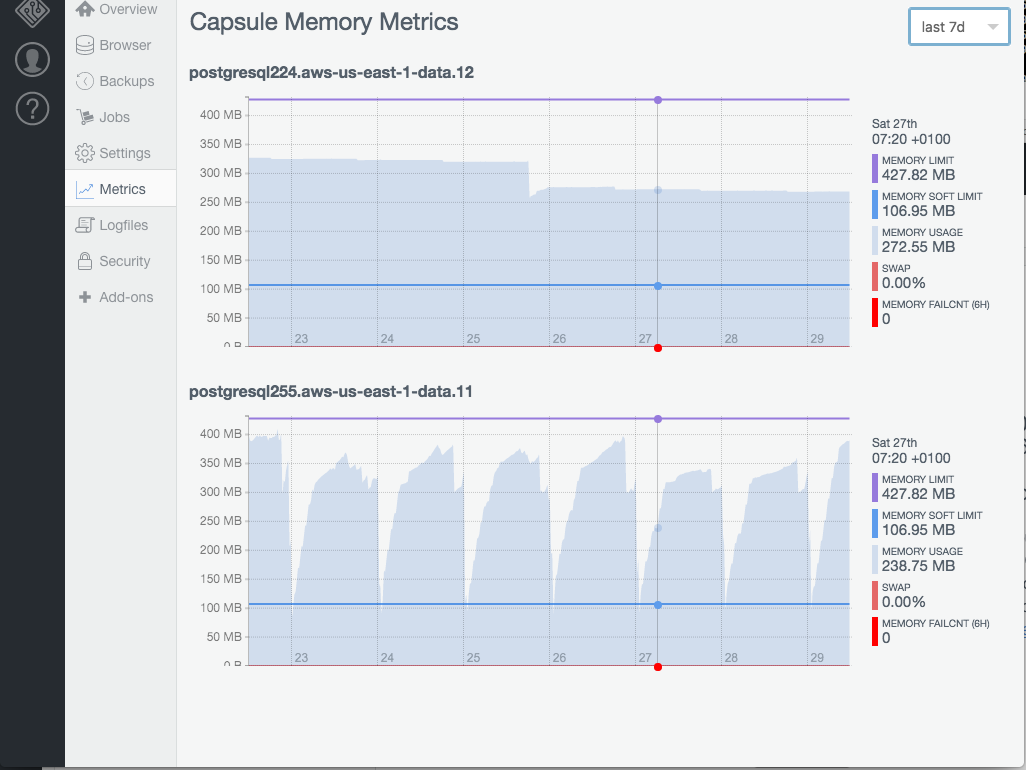
Right now we have only replicated the metrics we already gathered in previous systems - basic memory usage for customer containers as well as host-level resource usage for our own operations. The next logical step is enabling the database teams to push metrics to the local Telegraf instance from inside the DB containers so we can record database-level stats too without increasing number of targets to scrape.
We also have several other systems that we want to get into Prometheus to get better visibility. We run our apps on Mesos and have integrated basic Docker container metrics already, which is better than previously, but we also want to have more of the infrastructure components in the Mesos cluster recording to the central Prometheus so we can have centralised dashboards showing all elements of supporting system health from load balancers right down to app metrics.
Eventually we will need to shard Prometheus. We already split customer deployments among many smaller clusters for a variety of reasons so the one logical option would be to move to a smaller Prometheus server (or a pair for redundancy) per cluster rather than a single global one.
For most reporting needs this is not a big issue as we usually don’t need hosts/containers from different clusters in the same dashboard, but we may keep a small global cluster with much longer retention and just a modest number of down-sampled and aggregated metrics from each cluster’s Prometheus using Recording Rules.