Continuing our series of interviews with users of Prometheus, Ludovic Poitou from ForgeRock talks about their monitoring journey.
Can you tell us about yourself and what ForgeRock does?
I’m Ludovic Poitou, Director of Product Management at ForgeRock, based near Grenoble, France. ForgeRock is an international identity and access management software company with more than 500 employees, founded in Norway in 2010, now headquartered in San Francisco, USA. We provide solutions to secure every online interaction with customers, employees, devices and things. We have more than 800 customers from finance companies to government services.
What was your pre-Prometheus monitoring experience?
The ForgeRock Identity Platform has always offered monitoring interfaces. But the platform is composed of 4 main products, each of them had different options. For example, the Directory Services product offered monitoring information through SNMP, JMX or LDAP, or even a RESTful API over HTTP in the most recent versions. Other products only had REST or JMX. As a result, monitoring the whole platform was complex and required tools that were able to integrate those protocols.
Why did you decide to look at Prometheus?
We needed to have a single and common interface for monitoring all our products, but while keeping the existing ones for backward compatibility.
We started to use DropWizard to collect the metrics in all products. At the same time, we were starting to move these products to the cloud and run them in Docker and Kubernetes. So, Prometheus became evident because of its integration with Kubernetes, its simplicity for deployments, and the integration of Grafana. We also looked at Graphite and while we also added support for it in our products, it’s hardly being used by our customers.
How did you transition?
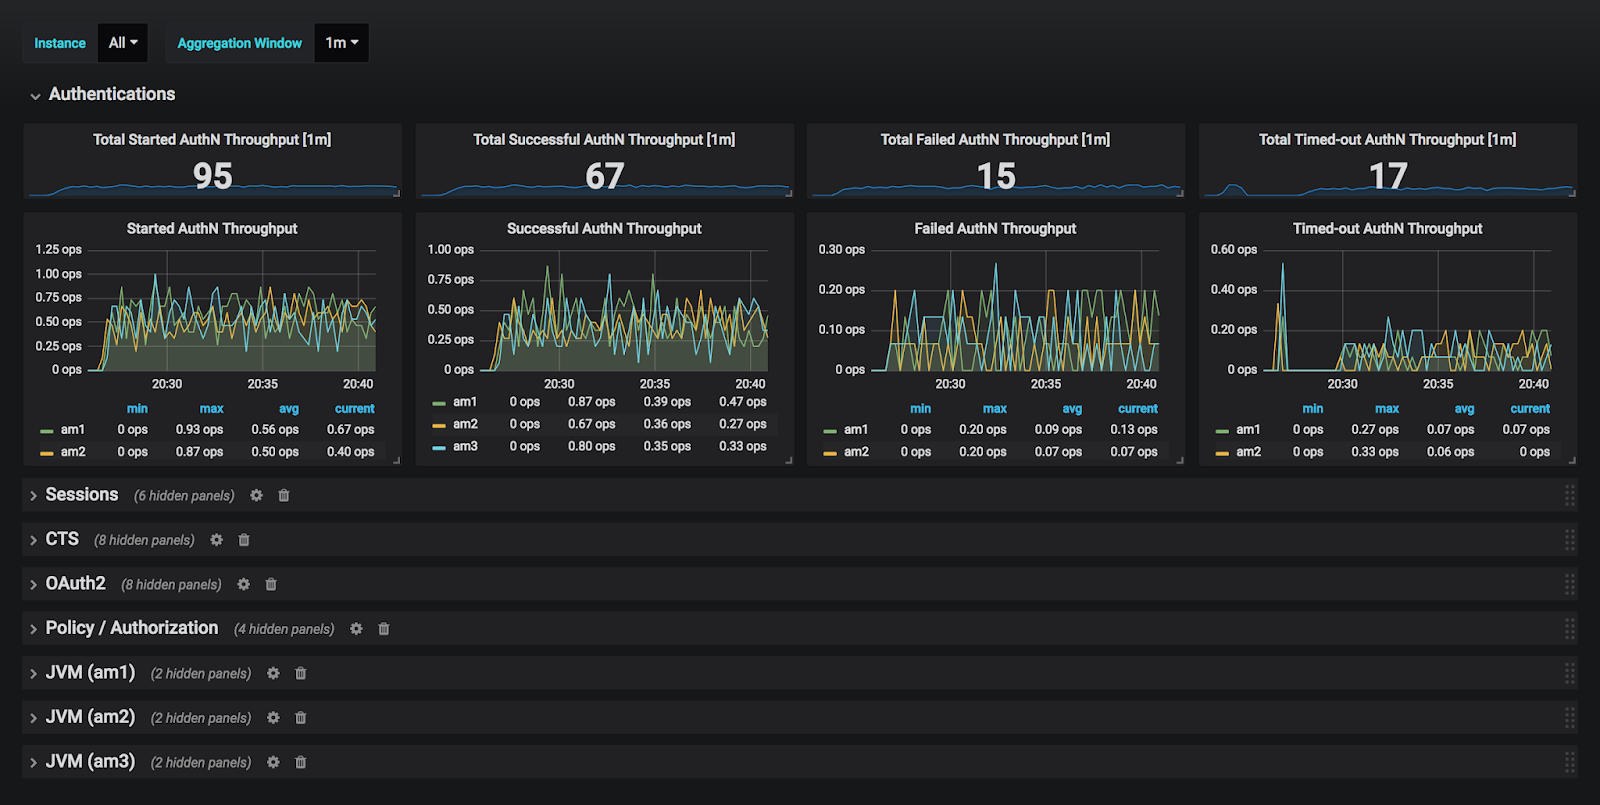
Some of our products were already using the DropWizard library and we had decided to use a common library in all products, so DropWizard was an obvious choice to code the instrumentation. But very quickly, we faced an issue with the data model. Prometheus interface uses dimensions, while we tend to have a hierarchical model for metrics. We also started to use Micrometer and quickly hit some constraints. So we ended up building a custom implementation to collect our metrics using the Micrometer interface. We adapted DropWizard Metrics to meet our requirements and made the adjustments to the DropWizard Prometheus exporter. Now with a single instrumentation we can expose the metrics with dimensions or hierarchically. Then we’ve started building sample Grafana dashboards that our customer can install and customise to have their own monitoring views and alerts.
We do continue to offer the previous interfaces, but we strongly encourage our customers to use Prometheus and Grafana.
What improvements have you seen since switching?
The first benefits came from our Quality Engineering team. As they started to test our Prometheus support and the different metrics, they started to enable it by default on all stress and performance tests. They started to customise the Grafana dashboards for the specific tests. Soon after, they started to highlight and point at various metrics to explain some performance issues.
When reproducing the problems in order to understand and fix them, our engineering team used Prometheus as well and extended some dashboards. The whole process gave us a better product and a much better understanding of which metrics are important to monitor and visualise for customers.
What do you think the future holds for ForgeRock and Prometheus?
ForgeRock has started an effort to offer its products and solutions as a service. With that move, monitoring and alerting are becoming even more critical, and of course, our monitoring infrastructure is based on Prometheus. We currently have two levels of monitoring, one per tenant, where we use Prometheus to collect data about one customer environment, and we can expose a set of metrics for that customer. But we have also built a central Prometheus service where metrics from all deployed tenants is pushed, so that our SRE team can have a really good understanding of what and how all customers environments are running. Overall I would say that Prometheus has become our main monitoring service and it serves both our on-premise customers, and ourselves running our solutions as a Service.