Continuing our series of interviews with users of Prometheus, Kevin Burton from Scalefastr talks about how they are using Prometheus.
Can you tell us about yourself and what Scalefastr does?
My name is Kevin Burton and I’m the CEO of Scalefastr. My background is in distributed systems and I’ve previously ran Datastreamer, a company that built a petabyte scale distributed social media crawler and search engine.
At Datastreamer we ran into scalability issues regarding our infrastructure and built out a high performance cluster based on Debian, Elasticsearch, Cassandra, and Kubernetes.
We found that many of our customers were also struggling with their infrastructure and I was amazed at how much they were paying for hosting large amounts of content on AWS and Google Cloud.
We continually evaluated what it costs to run in the cloud and for us our hosting costs would have been about 5-10x what we currently pay.
We made the decision to launch a new cloud platform based on Open Source and cloud native technologies like Kubernetes, Prometheus, Elasticsearch, Cassandra, Grafana, Etcd, etc.
We’re currently hosting a few customers in the petabyte scale and are soft launching our new platform this month.
What was your pre-Prometheus monitoring experience?
At Datastreamer we found that metrics were key to our ability to iterate quickly. The observability into our platform became something we embraced and we integrated tools like Dropwizard Metrics to make it easy to develop analytics for our platform.
We built a platform based on KairosDB, Grafana, and our own (simple) visualization engine which worked out really well for quite a long time.
They key problem we saw with KairosDB was the rate of adoption and customer demand for Prometheus.
Additionally, what’s nice about Prometheus is the support for exporters implemented by either the projects themselves or the community.
With KairosDB we would often struggle to build out our own exporters. The chance that an exporter for KairosDB already existing was rather low compared to Prometheus.
For example, there is CollectD support for KairosDB but it’s not supported very well in Debian and there are practical bugs with CollectD that prevent it from working reliability in production.
With Prometheus you can get up and running pretty quickly (the system is rather easy to install), and the chance that you have an exporter ready for your platform is pretty high.
Additionally, we’re expecting customer applications to start standardizing on Prometheus metrics once there are hosted platforms like Scalefastr which integrate it as a standardized and supported product.
Having visibility into your application performance is critical and the high scalability of Prometheus is necessary to make that happen.
Why did you decide to look at Prometheus?
We were initially curious how other people were monitoring their Kubernetes and container applications.
One of the main challenges of containers is the fact that they can come and go quickly leaving behind both log and metric data that needs to be analyzed.
It became clear that we should investigate Prometheus as our analytics backend once we saw that people were successfully using Prometheus in production along with a container-first architecture - as well as the support for exporters and dashboards.
How did you transition?
The transition was somewhat painless for us since Scalefastr is a greenfield environment.
The architecture for the most part is new with very few limiting factors.
Our main goal is to deploy on bare metal but build cloud features on top of existing and standardized hardware.
The idea is to have all analytics in our cluster backed by Prometheus.
We provide customers with their own “management” infrastructure which includes Prometheus, Grafana, Elasticsearch, and Kibana as well as a Kubernetes control plane. We orchestrate this system with Ansible which handles initial machine setup (ssh, core Debian packages, etc.) and baseline configuration.
We then deploy Prometheus, all the required exporters for the customer configuration, and additionally dashboards for Grafana.
One thing we found to be somewhat problematic is that a few dashboards on Grafana.com were written for Prometheus 1.x and did not port cleanly to 2.x. It turns out that there are only a few functions not present in the 2.x series and many of them just need a small tweak here and there. Additionally, some of the dashboards were written for an earlier version of Grafana.
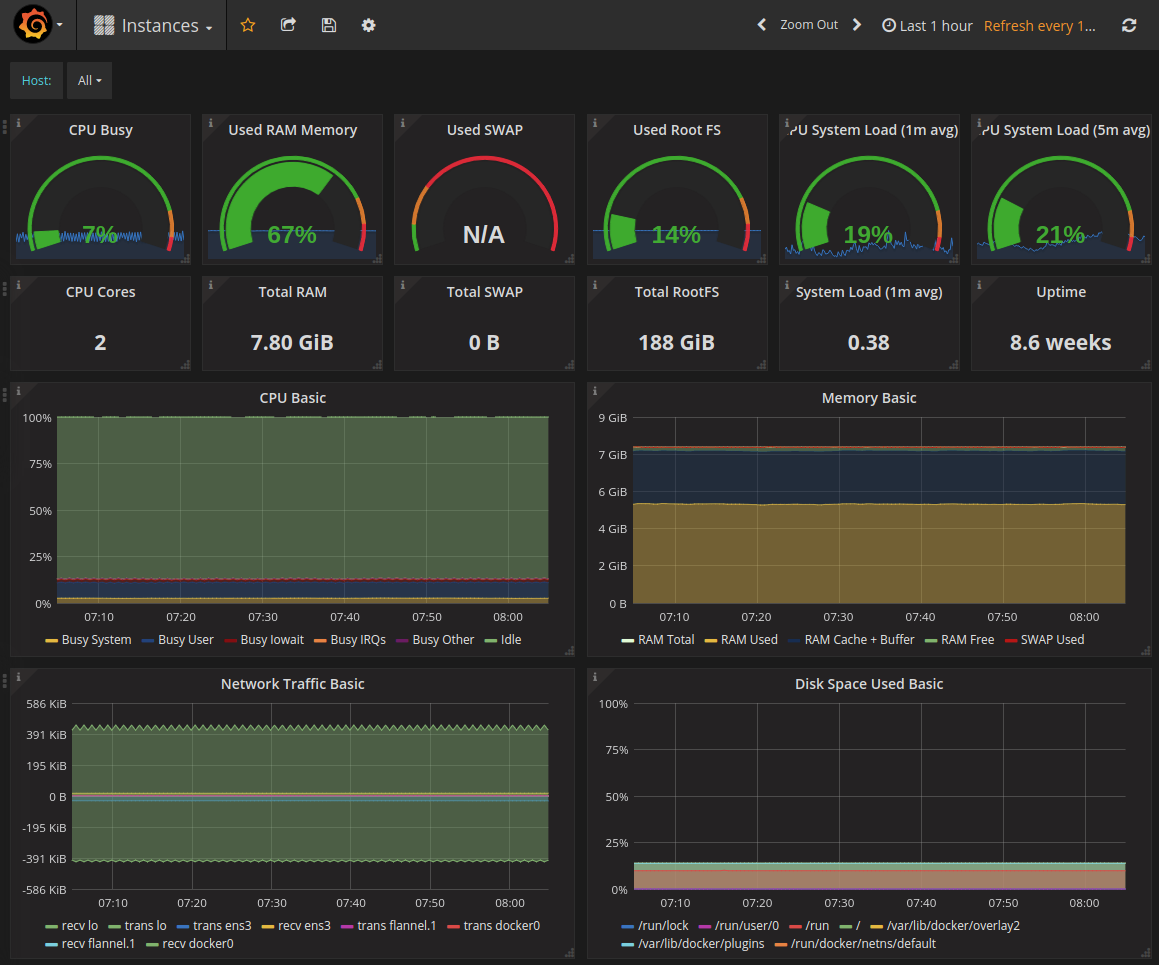
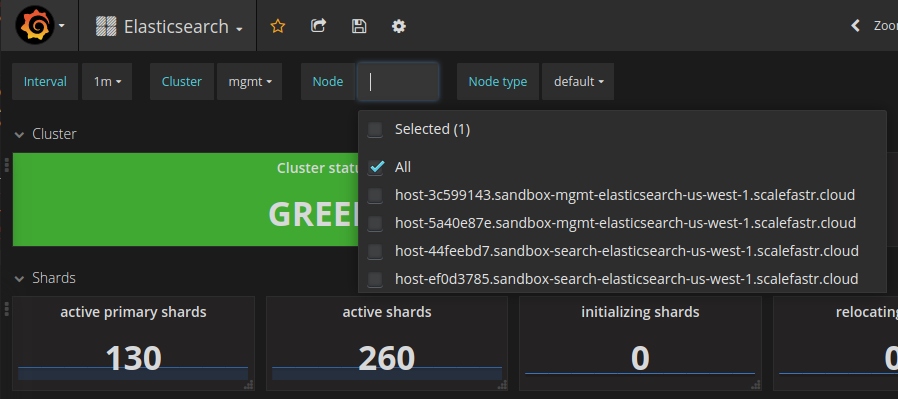
To help solve that we announced a project this week to standardize and improve dashboards for Prometheus for tools like Cassandra, Elasticsearch, the OS, but also Prometheus itself. We open sourced this and published it to Github last week.
We’re hoping this makes it easy for other people to migrate to Prometheus.
One thing we want to improve is to automatically sync it with our Grafana backend but also to upload these dashboards to Grafana.com.
We also published our Prometheus configuration so that the labels work correctly with our Grafana templates. This allows you to have a pull down menu to select more specific metrics like cluster name, instance name, etc.
What improvements have you seen since switching?
The ease of deployment, high performance, and standardized exporters made it easy for us to switch. Additionally, the fact that the backend is fairly easy to configure (basically, just the daemon itself) and there aren’t many moving parts made it an easy decision.
What do you think the future holds for Scalefastr and Prometheus?
Right now we’re deploying Elasticsearch and Cassandra directly on bare metal. We’re working to run these in containers directly on top of Kubernetes and working toward using the Container Storage Interface (CSI) to make this possible.
Before we can do this we need to get Prometheus service discovery working and this is something we haven’t played with yet. Currently we deploy and configure Prometheus via Ansible but clearly this won’t scale (or even work) with Kubernetes since containers can come and go as our workload changes.
We’re also working on improving the standard dashboards and alerting. One of the features we would like to add (maybe as a container) is support for alerting based on holts winters forecasting.
This would essentially allow us to predict severe performance issues before they happen. Rather than waiting for something to fail (like running out of disk space) until we take action to correct it.
To a certain extent Kubernetes helps with this issue since we can just add nodes to the cluster based on a watermark. Once resource utilization is too high we can just auto-scale.
We’re very excited about the future of Prometheus especially now that we’re moving forward on the 2.x series and the fact that CNCF collaboration seems to be moving forward nicely.