This is the first in a series of interviews with users of Prometheus, allowing them to share their experiences of evaluating and using Prometheus. Our first interview is with Daniel from Life360.
Can you tell us about yourself and what Life360 does?
I’m Daniel Ben Yosef, a.k.a, dby, and I’m an Infrastructure Engineer for Life360, and before that, I’ve held systems engineering roles for the past 9 years.
Life360 creates technology that helps families stay connected, we’re the Family Network app for families. We’re quite busy handling these families - at peak we serve 700k requests per minute for 70 million registered families.
![]()
We manage around 20 services in production, mostly handling location requests from mobile clients (Android, iOS, and Windows Phone), spanning over 150+ instances at peak. Redundancy and high-availability are our goals and we strive to maintain 100% uptime whenever possible because families trust us to be available.
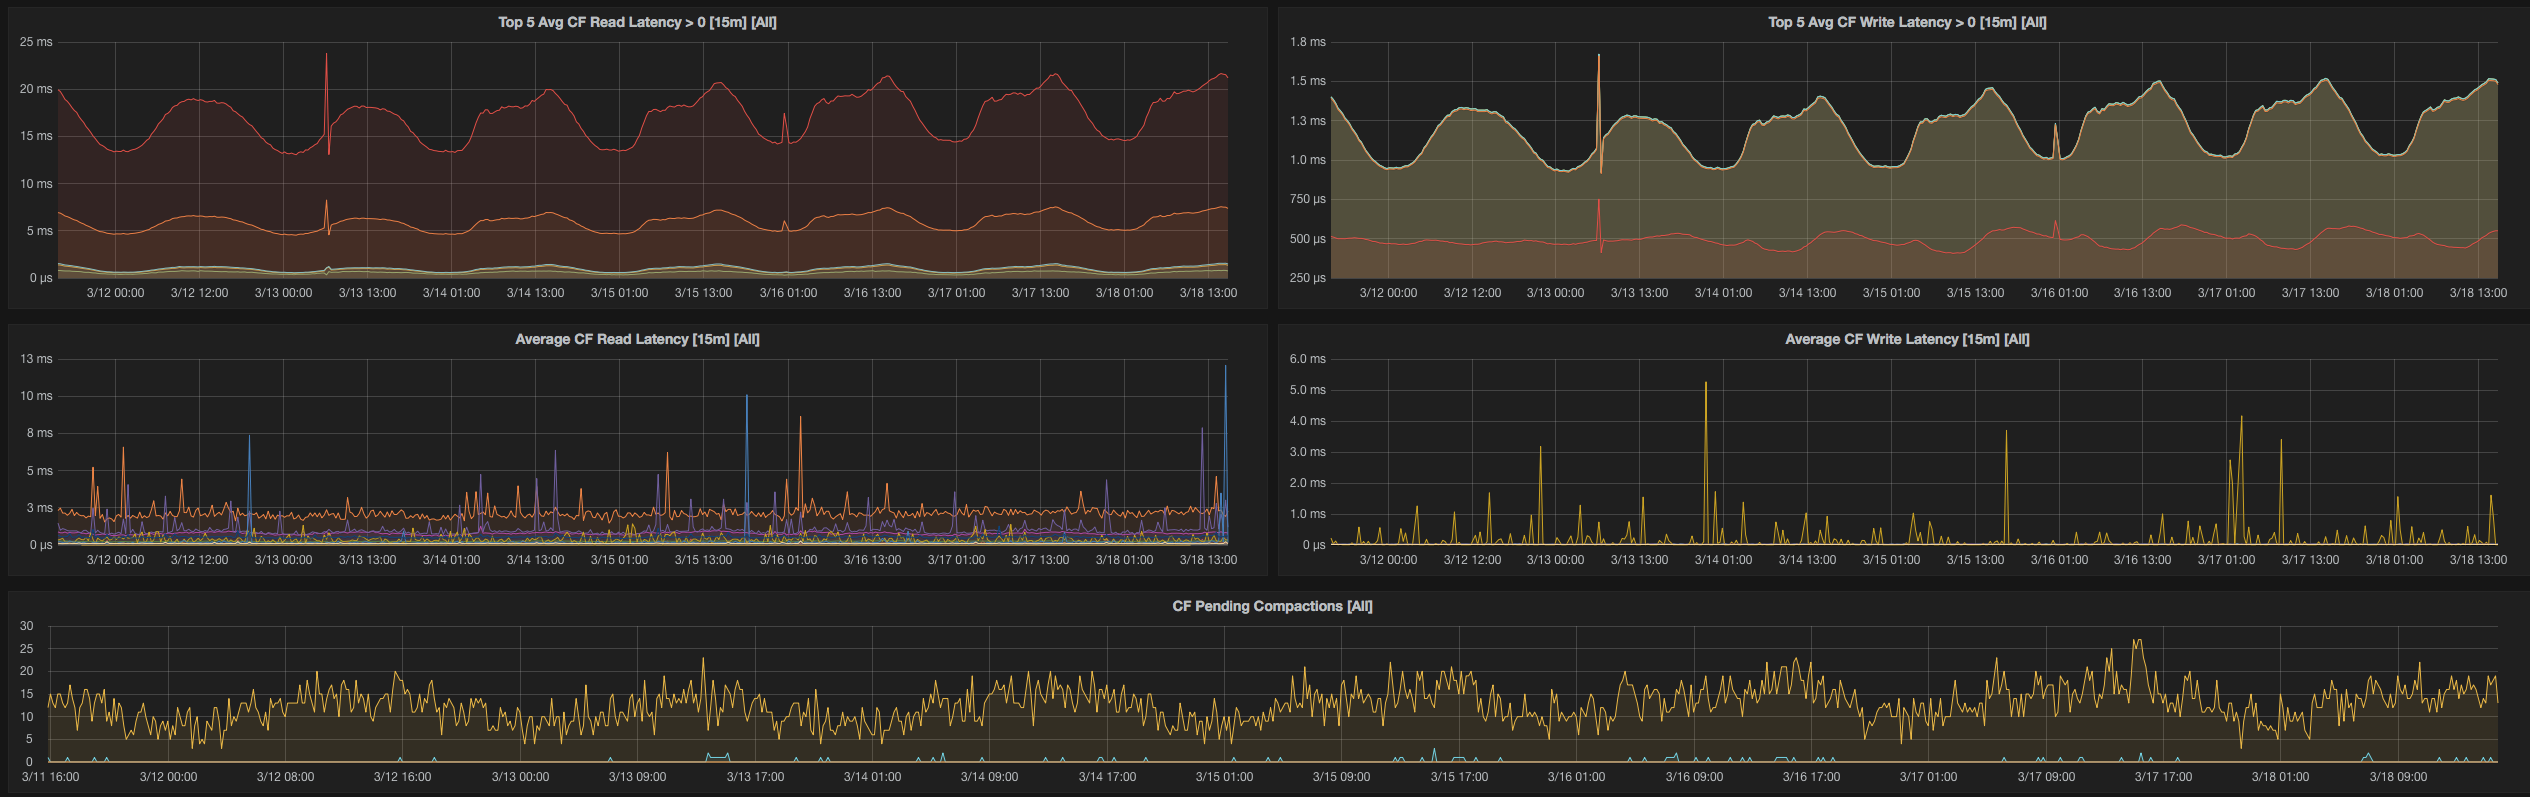
We hold user data in both our MySQL multi-master cluster and in our 12-node Cassandra ring which holds around 4TB of data at any given time. We have services written in Go, Python, PHP, as well as plans to introduce Java to our stack. We use Consul for service discovery, and of course our Prometheus setup is integrated with it.
What was your pre-Prometheus monitoring experience?
Our monitoring setup, before we switched to Prometheus, included many components such as:
- Copperegg (now Idera)
- Graphite + Statsd + Grafana
- Sensu
- AWS Cloudwatch
We primarily use MySQL, NSQ and HAProxy and we found that all of the monitoring solutions mentioned above were very partial, and required a lot of customization to actually get all working together.
Why did you decide to look at Prometheus?
We had a few reasons for switching to Prometheus, one of which is that we simply needed better monitoring.
Prometheus has been known to us for a while, and we have been tracking it and reading about the active development, and at a point (a few months back) we decided to start evaluating it for production use.
The PoC results were incredible. The monitoring coverage of MySQL was amazing, and we also loved the JMX monitoring for Cassandra, which had been sorely lacking in the past.
How did you transition?
We started with a relatively small box (4GB of memory) as an initial point. It was effective for a small number of services, but not for our full monitoring needs.
We also initially deployed with Docker, but slowly transitioned to its own box on an r3.2xl instance (60GB ram), and that holds all of our service monitoring needs with 30 days of in-memory data.
We slowly started introducing all of our hosts with the Node Exporter and built Grafana graphs, up to the point where we had total service coverage.
We were also currently looking at InfluxDB for long term storage, but due to recent developments, this may no longer be a viable option.
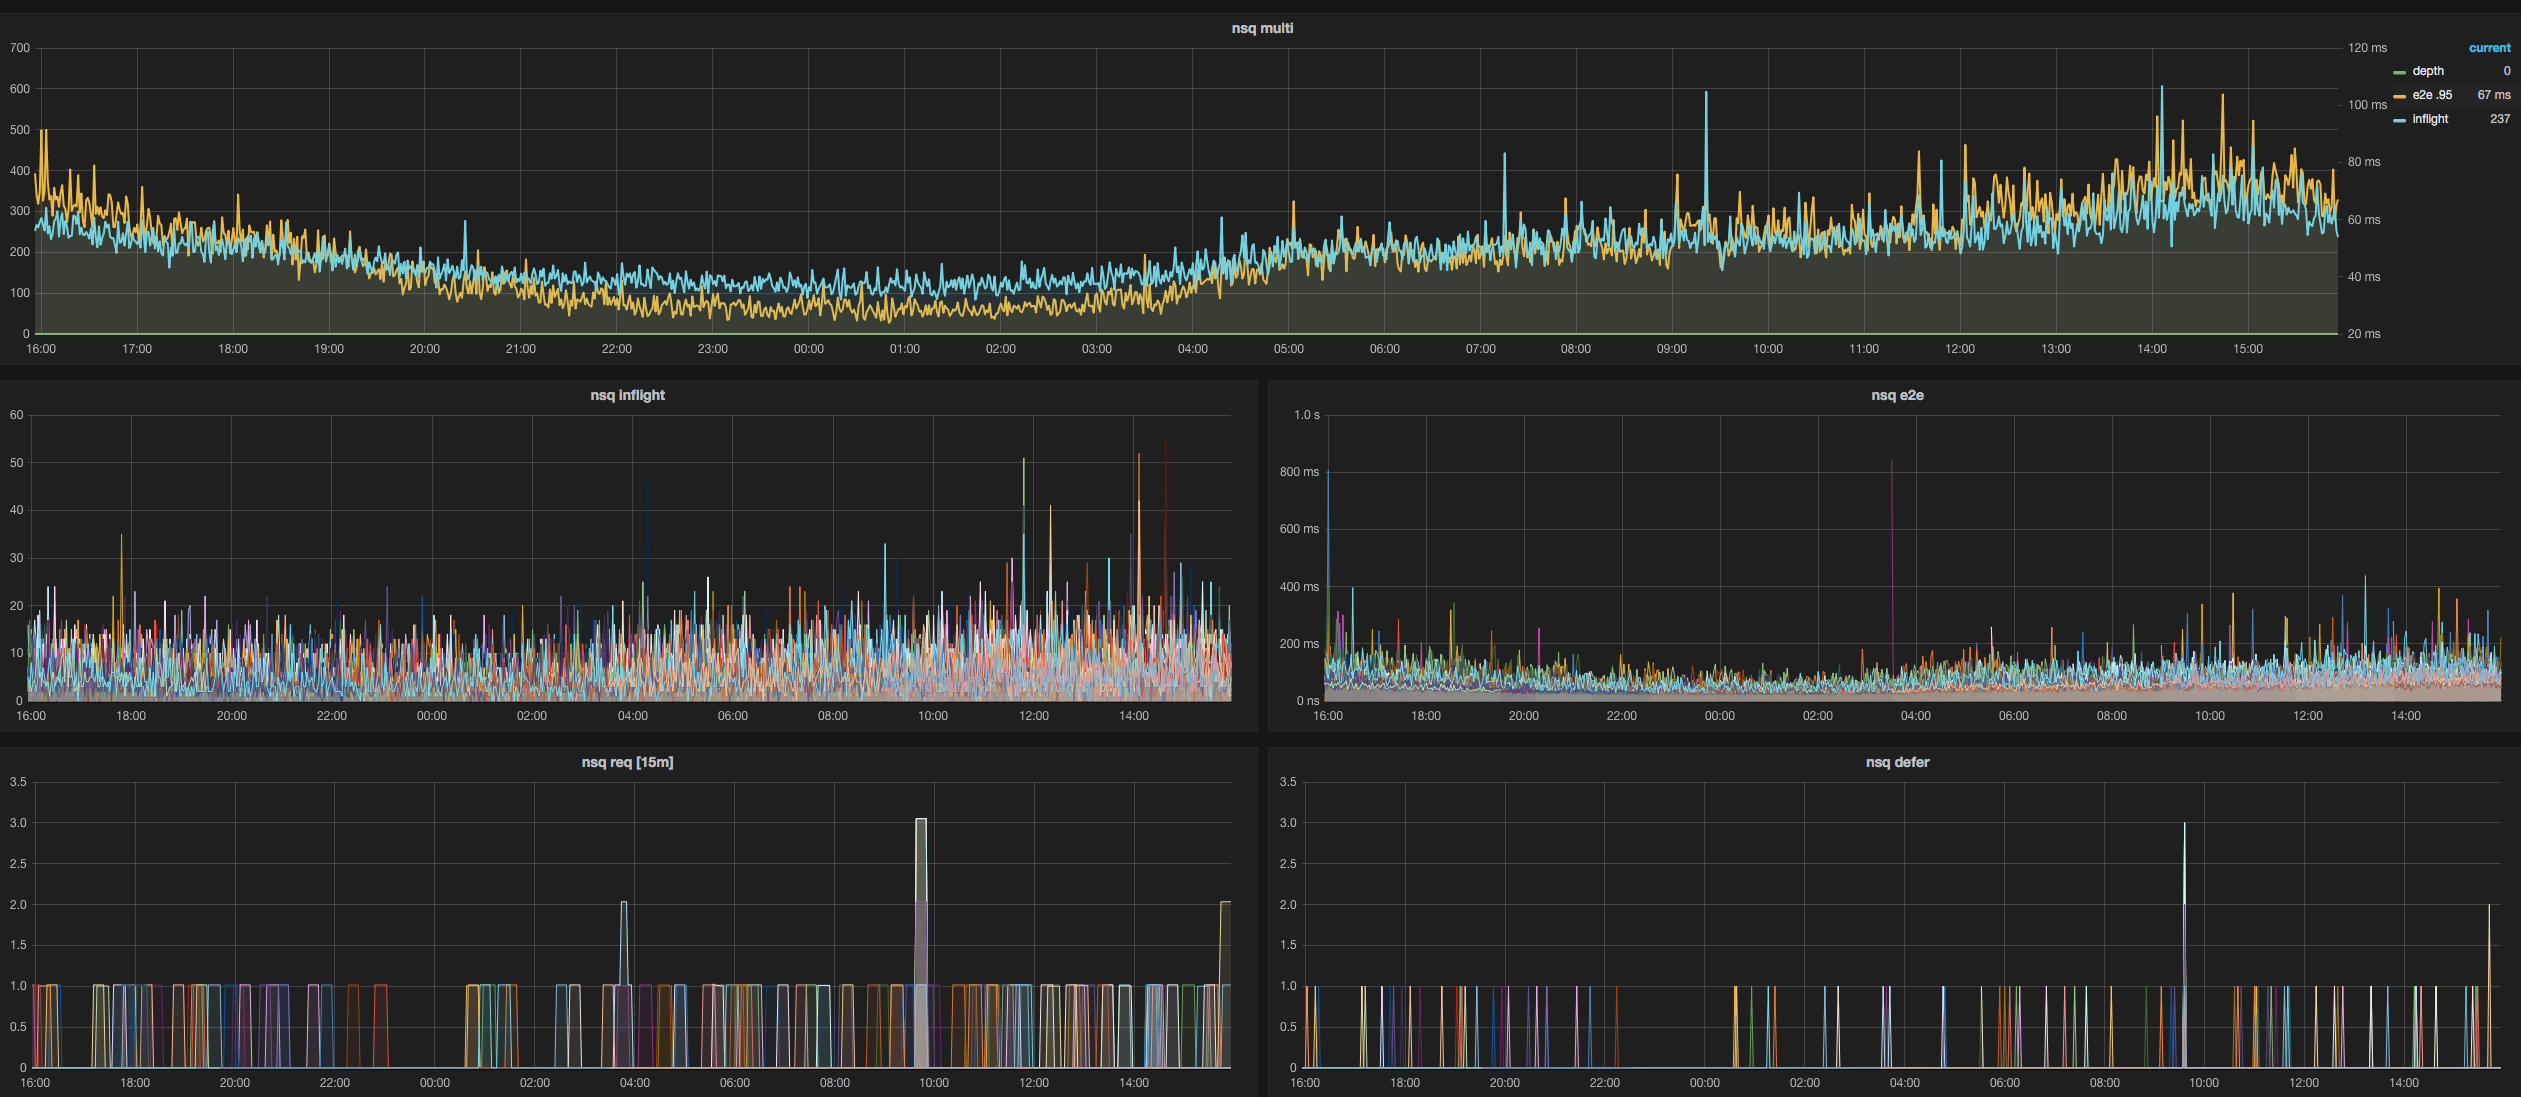
We then added exporters for MySQL, Node, Cloudwatch, HAProxy, JMX, NSQ (with a bit of our own code), Redis and Blackbox (with our own contribution to add authentication headers).
What improvements have you seen since switching?
The visibility and instrumentation gain was the first thing we saw. Right before switching, we started experiencing Graphite’s scalability issues, and having an in-place replacement for Graphite so stakeholders can continue to use Grafana as a monitoring tool was extremely valuable to us. Nowadays, we are focusing on taking all that data and use it to detect anomalies, which will eventually become alerts in the Alert Manager.
What do you think the future holds for Life360 and Prometheus?
We currently have one of our projects instrumented directly with a Prometheus client, a Python-based service. As we build out new services, Prometheus is becoming our go-to for instrumentation, and will help us gain extremely meaningful alerts and stats about our infrastructure.
We look forward to growing with the project and keep contributing.
Thank you Daniel! The source for Life360's dashboards is shared on Github.